Dealer Inventory Scorecard
You can process a Dealer Inventory Scorecard report to determine:
If your current inventory is overstocked/understocked based on the current inventory value and the inventory turn rate.
If your parts are overstocked/understocked based on purchases and usage.
If your supplies are overstocked/understocked based on purchases and usage.
The monetary value and percentage of your inventory that is dead inventory.
How your current percentage of rescheduled service calls compares with your target percentage of rescheduled service calls.
The monthly monetary impact of rescheduled service calls on your business.
You specify report parameters that identify the items in your inventory defined as parts and the items in your inventory defined as supplies, the time period for which you want to run the report (which should be one quarter in length), the period of time in months after which to consider an in-stock inventory item dead if the item has not been used or received into inventory, and the impact of rescheduled calls on your business.
The main report includes the following information:
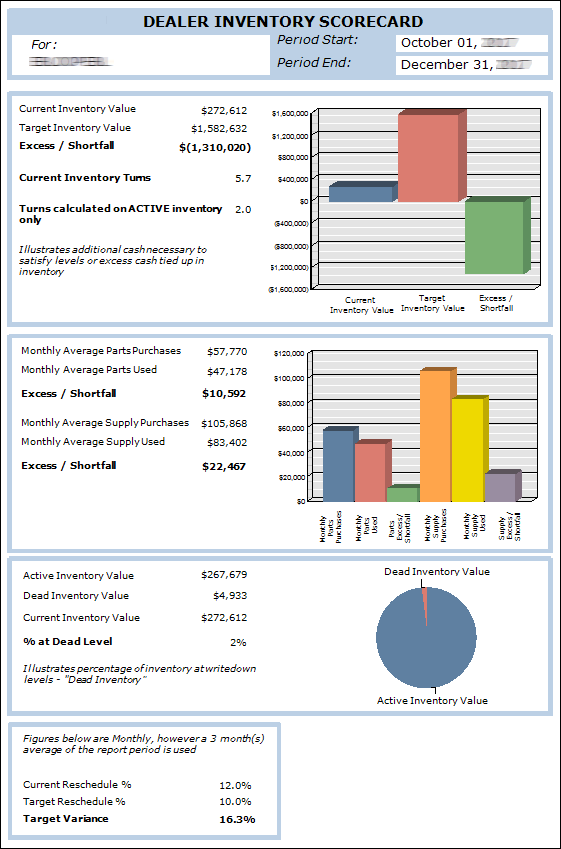
Current Inventory Value Metrics: Current Inventory Value*, Target Inventory Value*, Excess/Shortfall*, Current Inventory Turns, and Turns Calculated on Active Inventory Only.
Current Inventory Purchase and Usage Metrics: Monthly Average Parts Purchases*, Monthly Average Parts Used*, Parts Excess/Shortfall*, Monthly Average Supply Purchases*, Monthly Average Supplies Used*, and Supplies Excess/Shortfall*.
Dead Inventory Metrics: Active Inventory Value ♦ , Dead Inventory Value ♦ , Current Inventory Value ♦ , and % at Dead Level.
Rescheduled Service Call Metrics: Current Reschedule %, Target Reschedule %, and Target Variance.
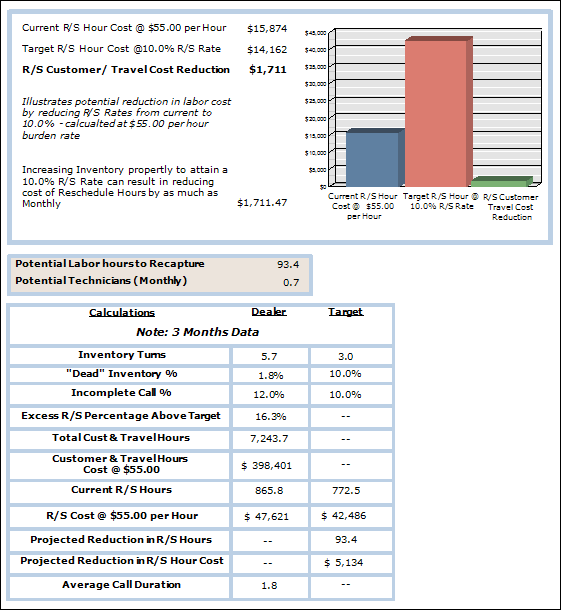
Monthly Monetary Impact of Rescheduled Service Calls: Current Cost of Rescheduled Service Calls*, Target Cost of Rescheduled Service Calls*, and Rescheduled Call Customer and Travel Cost Reduction that could be achieved by increasing technician inventory*.
Labor Impact of Rescheduled Service Calls: Potential Labor Hours to Recapture (based on report's time period) and Potential Technicians that could be saved per month if all rescheduled calls were eliminated.
Calculations and/or Comparison of Actual Values to Target Values: Inventory Turns, "Dead" Inventory %, Incomplete Call %, Excess Rescheduled Service Call Percentage Above Target, Total Customer and Travel Hours, Customer and Travel Hours Cost, Current Rescheduled Service Call Hours, Monetary Value of Rescheduled Service Calls, Projected Reduction in Rescheduled Service Call Hours, Projected Reduction in Rescheduled Service Call Cost, and Average Call Duration.
Summary Detail:
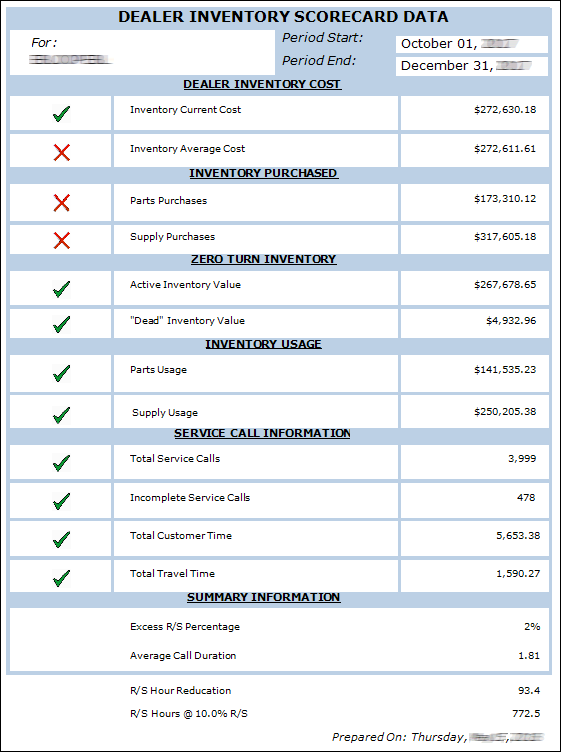
Dealer Inventory Cost: Inventory Current Cost^ and Inventory Average Cost^
Inventory Purchased: Parts Purchased^ and Supplies Purchased^
Zero Turn Inventory: Active Inventory Value^ and "Dead" Inventory Value^
Inventory Usage: Parts Usage^ and Supply Usage^
Service Call Information: Total Service Calls^, Incomplete Service Calls^, Total Customer Time^, and Total Travel Time^
Summary Information: Excess Rescheduled Service Call Percentage and Average Call Duration
Rescheduled Service Call Hour Reduction
Rescheduled Service Call Hours at Target Percentage of Rescheduled Service Calls
This report offers drill-down capabilities. You can access Dealer Inventory Cost Details, Inventory Purchased Details, Dead Inventory (Zero Inventory Turn) Details, Inventory Usage Details, and Service Call Details sub reports by double clicking in the corresponding tables on the third page of the main report. Additionally, you can access an Inventory Purchased Details (Transaction-level) sub report from the Inventory Purchased Details sub report.
Getting to the ReportGetting to the Report
Log in to e-automate with appropriate permissions.
Click [Reports] to open the Report Console window.
In the left pane, click Inventory.
In the right pane, double-click Dealer Inventory Scorecard to open the Dealer Inventory Scorecard window.
Setting Report ParametersSetting Report Parameters
When setting report parameters, each parameter you have selected displays in the upper portion of the right pane. The parameters do not reset. The report displays with the parameters that were set the last time you ran the report. You can use the following parameters:
Define PartsDefine Parts
Use the Define Parts filter to include in the report the items in your inventory defined as parts (e.g., use the advanced filter option to filter for select all items with a Category of P for Parts).
To filter for items defined as parts, do the following:
In the left pane of the Dealer Inventory Scorecard window, select Define Parts to display the Define Parts region in the right pane.
Do one of the following:
If you want to indicate all items are defined as parts, in the Define Parts region, check the Include all Define Parts checkbox.
If you want to specify the range of items that are defined as parts, do the following:
Uncheck the Include all Define Parts checkbox.
In the From field, enter the beginning item defined as a part or use the lookup to select an item defined as a part.
In the To field, enter the ending item defined as a part or use the lookup to select an item defined as a part.
If you want to select items defined as parts using the advanced filter, do the following:
Uncheck the Include all Define Parts checkbox.
Check the Use advanced filter box.
Click the [Advanced filter] button to open the Define Parts window.
Use the QuickSearch functionality to filter for the items defined as parts you want to include in the report. For information on using QuickSearch functionality, see the Using the QuickSearch topic.
When the Define Parts window displays the items defined as parts you want to include in the report, click [OK] to return to the Dealer Inventory Scorecard window.
Define SuppliesDefine Supplies
Use the Define Supplies filter to include in the report the items in your inventory defined as supplies (e.g., use the advanced filter option to filter for select all items with a Category of S for Supplies).
To filter for items defined as supplies, do the following:
In the left pane of the Dealer Inventory Scorecard window, select Define Supplies to display the Define Supplies region in the right pane.
Do one of the following:
If you want to include all items defined as supplies, in the Define Supplies region, check the Include all Define Supplies checkbox.
If you want to select a range of items defined as supplies, do the following:
Uncheck the Include all Define Supplies checkbox.
In the From field, enter the beginning item defined as a supply or use the lookup to select an item defined as a supply.
In the To field, enter the ending item defined as a supply or use the lookup to select an item defined as a supply.
If you want to select items defined as supplies using the advanced filter, do the following:
Uncheck the Include all Define Supplies checkbox.
Check the Use advanced filter box.
Click the [Advanced filter] button to open the Define Supplies window.
Use the QuickSearch functionality to filter for the items defined as supplies you want to include in the report. For information on using QuickSearch functionality, see the Using the QuickSearch topic.
When the Define Supplies window displays the items defined as supplies you want to include in the report, click [OK] to return to the Dealer Inventory Scorecard window.
Date Range (calculations are based on a three-month date range)Date Range (calculations are based on a three-month date range)
You can define the date range to run the report for any time period, but the report is optimized to be run for a time period of three months (one quarter). Some of the report calculations will only be accurate if you run the report for a three-month period.
To filter by date range, do the following:
In the left pane of the Dealer Inventory Scorecard window, select Date Range... to display the Date Range (calculations are based on a three-month date range) region in the right pane.
Do one of the following:
To include all dates, in the Date Range (calculations are based on a three-month date range) region, use the drop-down menu to select <All Dates>.
To use a pre-defined date range, in the Date Range (calculations are based on a three-month date range) region, use the drop-down menu to select a pre-configured date option (e.g., Last Fiscal Quarter).
To specify a custom date range, do the following:
In the Date Range (calculations are based on a three-month date range) region, use the drop-down menu to select <Custom>.
In the From field, enter the beginning date or use the drop-down calendar to select a date.
In the To field, enter the ending date or use the drop-down calendar to select a date.
Dead Inventory Use MonthsDead Inventory Use Months
Use the Dead Inventory Use Months filter to indicate the time period that must elapse for you to consider an inventory item to be dead if it has not been used in a sales order, service call, or work order during that period. The default value is 18 months, but you can override this value if desired. The system searches for dead inventory using the number of months you specify and counting backward in time from the end date you specify for the report.
To specify the number of months to search usage for dead inventory from the end date you specify for the report, do the following:
In the left pane of the Dealer Inventory Scorecard window, select Dead Inventory Use Months to display the Dead Inventory Use Months region in the right pane.
In the Dead Inventory Use Months field, enter the number of months from the report's end date that must elapse before you consider an inventory item to be dead inventory.
Dead Inventory Receipt MonthsDead Inventory Receipt Months
Use the Dead Inventory Receipt Months filter to indicate the time period that must elapse for you to consider an inventory item to be dead if it has not been received into inventory during that period. The default value is 18 months, but you can override this value if desired. The system searches for dead inventory using the number of months you specify and counting backward in time from the end date you specify for the report.
To specify the number of months to search receipts for dead inventory from the end date you specify for the report, do the following:
In the left pane of the Dealer Inventory Scorecard window, select Dead Inventory Receipt Months to display the Dead Inventory Receipt Months region in the right pane.
In the Dead Inventory Receipt Months field, enter the number of months from the report's end date that must elapse before you consider an inventory item to be dead inventory if the item has not been included on an inventory receipt.
Rescheduled Hour CostRescheduled Hour Cost
Use the Rescheduled Hour Cost to identify the average cost-per-hour of a rescheduled call (e.g., the average cost-per-hour of having a technician service equipment). The report uses this parameter together with the Target Reschedule Percentage and Monthly Technician Hours parameters to determine the impact of rescheduled calls.
To specify the average cost-per-hour of a rescheduled call, do the following:
In the left pane of the Dealer Inventory Scorecard window, select Rescheduled Hour Cost to display the Rescheduled Hour Cost region in the right pane.
In the Rescheduled Hour Cost field, enter the monetary amount representing the average cost-per-hour of a rescheduled call. The default value is $65.00, but you can override this value.
Target Reschedule PercentageTarget Reschedule Percentage
Use the Target Reschedule Percentage to identify the percentage of service calls that you do not want rescheduled calls to exceed. The report uses this parameter together with the Rescheduled Hour Cost and Monthly Technician Hours parameters to determine the impact of rescheduled calls.
To specify the percentage of service calls that you do not want rescheduled calls to exceed, do the following:
In the left pane of the Dealer Inventory Scorecard window, select Target Reschedule Percentage to display the Target Reschedule Percentage region in the right pane.
In the Target Reschedule Percentage field, specify the percentage of service calls that you do not want rescheduled calls to exceed.
Monthly Technician HoursMonthly Technician Hours
Use the Monthly Technician Hours to specify the average number of hours one technician can work in a given month. The report uses this parameter together with the Rescheduled Hour Cost and Target Reschedule Percentage parameters to determine the impact of rescheduled calls.
To specify the average number of hours one technician can work in a given month, do the following:
In the left pane of the Dealer Inventory Scorecard window, select Monthly Technician Hours to display the Monthly Technician Hours region in the right pane.
In the Monthly Technician Hours field, specify the average number of hours one technician can work in a given month.
Processing the ReportProcessing the Report
On the Dealer Inventory Scorecard window, click [OK] to process the report.
Viewing Sub ReportsViewing Sub Reports
Using the main report's drill-down capabilities, you can view Dealer Inventory Cost Details, Inventory Purchased Details, Dead Inventory Details (Zero Inventory Turn), Inventory Usage Details, and Service Call Details sub reports.
Dealer Inventory Cost Details Sub ReportDealer Inventory Cost Details Sub Report
The Dealer Inventory Cost Details sub report includes the following information:
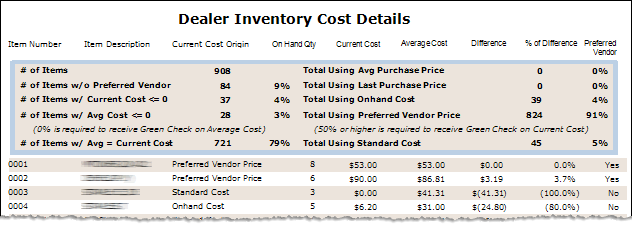
Dealer Inventory Cost Summary Details: # of Items, # of Items w/o Preferred Vendor, # of Items w/ Current Cost <= 0, # of Items w Avg Cost <= 0, # of Items w/ Avg = Current Cost, Total Using Avg Purchase Price, Total Using Last Purchase Price, Total Using Onhand Cost, Total Using Preferred Vendor Price, Total Using Standard Cost
Item Purchased Details: Item Number, Item Description, Current Cost Origin, On Hand Qty, Current Cost, Average Cost, Difference, % of Difference, Preferred Vendor (Yes/No)
To view the Dealer Inventory Cost Details sub report, do the following:
Go to the last page of the report.
Double-click anywhere in the Dealer Inventory Cost table to have the system display the sub report.
Inventory Purchased Details Sub ReportInventory Purchased Details Sub Report
Inventory Purchased Details (Item-level) Sub Report Inventory Purchased Details (Item-level) Sub Report
The Inventory Purchased Details (Item-level) sub report includes the following information:
Item Purchased Summary Details:
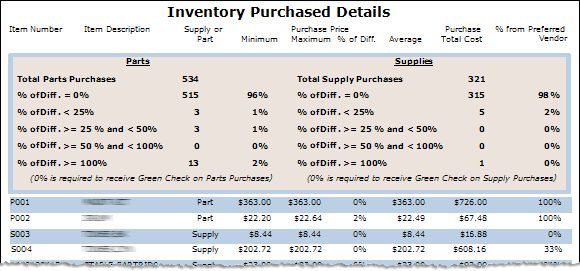
Parts: Total Parts Purchases, % of Diff. = 0%, % of Diff. >= 0% and < 25%, % of Diff. >= 25% and < 50%, % of Diff. >= 50% and < 100%, % of Diff. >= 100%
Supplies: Total Supplies Purchases, % of Diff. = 0%, % of Diff. >= 0% and < 25%, % of Diff. >= 25% and < 50%, % of Diff. >= 50% and < 100%, % of Diff. >= 100%
Item Purchased Details: Item Number, Item Description, Supply or Part, Minimum (Purchase Price), Maximum (Purchase Price), % of Diff., Average, Purchase Total Cost, % from Preferred Vendor
To view the Inventory Purchased Details (Item-level) sub report, do the following:
Go to the last page of the report.
Double-click anywhere in the Inventory Purchased table to have the system display the sub report.
Inventory Purchased Details (Transaction-level) Sub Report Inventory Purchased Details (Transaction-level) Sub Report
The Inventory Purchased Details (Transaction-level) sub report includes the following information:
Item Purchased Details Summary Row: Item Number, Item Description, Supply or Part, Minimum (Purchase Price), Maximum (Purchase Price), % of Diff., Average, Purchase Total Cost, % from Preferred Vendor
Item Purchased Details Summary Row: Item Number, Item Description, Supply or Part, Minimum (Purchase Price), Maximum (Purchase Price), % of Diff., Average, Purchase Total Cost, % from Preferred Vendor
To view the Inventory Purchased Details (Transaction-level) sub report, do the following:
Go to the last page of the report.
Double-click anywhere in the Inventory Purchased table to have the system display the sub report.
Double-click any detail row in the report to view the transaction-level detail for that row.
Dead Inventory Details (Zero Inventory Turn) Sub ReportDead Inventory Details (Zero Inventory Turn) Sub Report
The Dead Inventory Details (Zero Inventory Turn) sub report includes the following information:
Dead Inventory Summary Details: Active Inventory Value, Dead Inventory Value, Current Inventory Value, % at Dead Level, Pie Chart Graph of % at Zero Inventory Turn (Dead Inventory Value) level.
Dead Inventory Item Details: Item Number, Item Description, On Hand Quantity, Average Cost, Last Receipt Date, Last Use Date, Last Service Use Date, Last Work Order Use Date.
To view the Dead Inventory Details (Zero Inventory Turn) sub report, do the following:
Go to the last page of the report.
Double-click anywhere in the Zero Inventory Turn table to have the system display the sub report.
Inventory Usage Details Sub ReportInventory Usage Details Sub Report
The Inventory Usage Details sub report includes the following information:
Item Detail: Item Number, Item Description, Supply or Part, Average Cost, Service Calls (Quantity Used), Sales Orders (Quantity Used), Work Orders (Quantity Used), Total (Quantity Used), Total Usage (Average Cost)
Totals for Invoiced Call: If a call has been invoiced (Status = Invoiced), the system lists the following totals on separate rows below the call: Total Labor Hours, Total Overtime Hours, Total Interrupt Hours, Total Travel Hours, and overall Total Hours.
To view the Inventory Usage Details sub report, do the following:
Go to the last page of the report.
Double-click anywhere in the Inventory Usage table to have the system display the sub report.
Service Call Details Sub ReportService Call Details Sub Report
The Service Call Details sub report includes the following information:
Service Call Detail: Call Number, Customer Name, Call Description, Start Date, Close Date, Incomplete Call? (Yes/No), and Status (Cleared, OK to Invoice, Invoiced). If a call is marked incomplete (Incomplete Call? = Yes), the Rescheduled Call Number displays on a separate row below the call that was marked incomplete.
Totals for Invoiced Call: If a call has been invoiced (Status = Invoiced), the system lists the following totals on separate rows below the call: Total Labor Hours, Total Overtime Hours, Total Interrupt Hours, Total Travel Hours, and overall Total Hours.
To view the Service Call Details sub report, do the following:
Go to the last page of the report.
Double-click anywhere in the Service Call Information table to have the system display the sub report.
Understanding Report CalculationsUnderstanding Report Calculations
Main ReportMain Report
Following is a sample of the main Dealer Inventory Scorecard report. This report was processed for one fiscal quarter and includes all parts with an Item Category of P (Parts) and all supplies with an item Category of S (Supplies). The table below this sample report identifies the source of each of the numbers and/or the calculations for arriving at the numbers in the report. The additional sections of this topic provide similar information for each of the sub reports.
Main Report Images
The following table identifies the source of each of the numbers and/or the calculations for arriving at the numbers in the main Dealer Inventory Scorecard report.
|
Report Label |
Description and/or Calculation |
|
Current Inventory Value Metrics |
|
|
The total inventory average cost (inventory quantity * average cost) of the items included in the Define Parts and Define Supplies parameters you specified for the report.
Calculation: Current Inventory Value = Sum(Inventory Quantity * Average Cost for Each Item Included in Report)
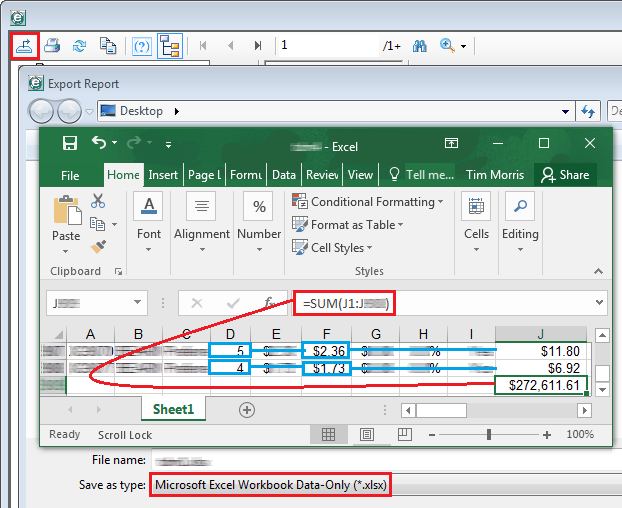
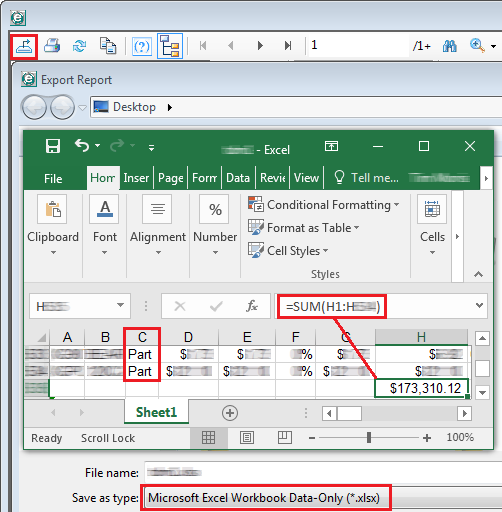
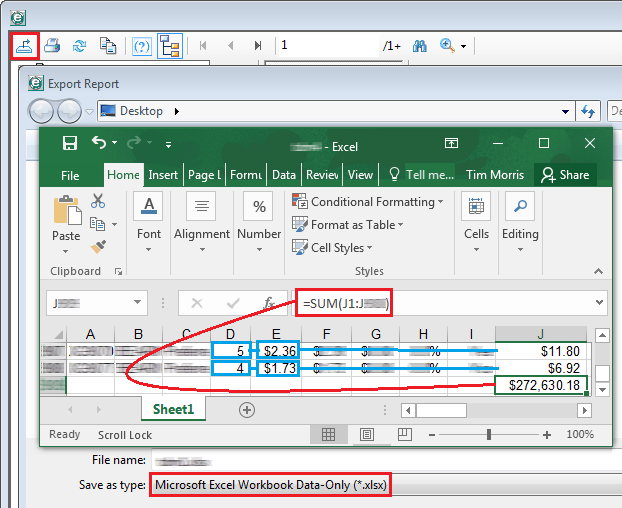
Example (based on Main Report image): Current Inventory Value = $272,612. Note: To see how the system arrives at this value ($272,612 in the sample image), see the Dealer Inventory Cost Details sub report. To get the exact monetary amount of the Current Inventory Value ($272,611.61), export the Dealer Inventory Cost Details sub report data to an Excel file, multiply the Quantity column (Column D) by the Average Cost column (Column F) and store the results in Column J, and then sum Column J.
 |
|
|
The system-projected average cost of the inventory you should have on hand based on the usage of the items as determined by your Define Parts and Define Supplies parameters on service calls, sales orders, and production work orders over the Date Range you specified for the report multiplied by a hard-coded value of 4.04 (optimized for a three-month, or quarterly, Date Range).
Calculation: Target Inventory Value = (Total Parts Usage Average Cost + Total Supply Usage Average Cost) * 4.04
Example (based on Main Report image): Target Inventory Value = ($141,535.23 Total Parts Usage Average Cost + $250,205.38 Total Supply Usage Average Cost) * 4.04 = $1,582,632 (rounded to nearest integer) Note: To see how the system arrives at the Total Parts Usage Average Cost and Total Supply Usage Average Cost, see the Inventory Usage table on Report Page 3 and/or the Inventory Usage Details sub report.
|
|
|
The system-projected average cost of surplus inventory or inventory shortage based on subtracting the system projected Target Inventory Value from your Current Inventory Value.
Calculation: Excess/Shortfall = Current Inventory Value - Target Inventory Value
Example (based on Main Report image): Excess/Shortfall = $272,612 Current Inventory Value - $1,582,632 Target Inventory Value = ($1,310,020) |
|
|
Total average cost value of items included in the report based on your Define Parts and Define Supplies parameters that were used on service calls, sales orders, and production work orders divided by 3, then divided by the current inventory value, and then multiplied by 12.
Calculation: Current Inventory Turns = ((Total Average Cost of Items Included in Report that Were Used During Report Date Range on Service Calls, Sales Orders, and/or Production Work Order / 3) / Current Inventory Value Based on Average Cost) * 12
Example (based on Main Report image): Current Inventory Turns = (($391,740.61 Total Average Cost of Items Included in Report that Were Used During Report Date Range on Service Calls, Sales Orders, and/or Production Work Order / 3) / 272,611.61 Current Inventory Value) * 12 = 5.7 (rounded to one decimal position) Note: To see how the system arrives at the Total Average Cost Amount, see the Inventory Usage table on Report Page 3 and/or the Inventory Usage Details sub report. This value is the sum of the Parts Usage ($141,535.23) and Supply Usage ($250,205.38) amounts, which equals $391,740.61. To see how the system arrives at the Current Inventory Value Based on Average Cost ($272,611.61), see the Dealer Inventory Cost Details sub report.
|
|
|
The system-calculated number of inventory turns based on dividing the Target inventory Value by 3 and then dividing that amount by the Active Inventory Value. The Active Inventory Value is the total item average cost minus the dead inventory value. Calculation: Active Inventory Value = Current Inventory Value Based on Average Cost - Dead Inventory Value Based on Average Cost Turns Calculated on Active Inventory = (Target inventory Value / 3) / Active Inventory Value
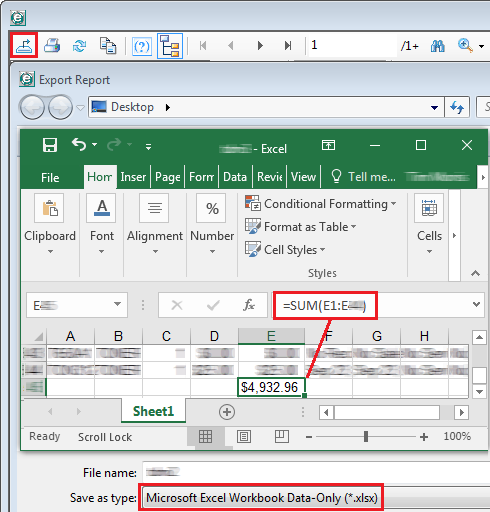
Example (based on Main Report image): Active Inventory Value = $272,611.61 Current Inventory Value Based on Average Cost - $4,932.96 Dead Inventory Value Based on Average Cost = $267,678.85 Turns Calculated on Active Inventory = ($1,582,632 Target inventory Value / 3) / $267,678.85 Active Inventory Value = 2.0 (1.98 rounded to 1 decimal position) Note: To see how the system arrives at the Dead Inventory Value ($4,932.96) to subtract from the Current Inventory Value ($272,611.61) to calculate the Active Inventory Value ($267,678.85), see the Dead Inventory (Zero Inventory Turn) Details sub report.
|
|
|
Current Inventory Purchase and Usage Metrics |
|
|
The total parts purchases for items included in the report based on your Define Parts parameter as received on PO Receipts during the Date Range you specified for the report divided by 3. Note: This calculation will only be accurate if you use a three-month Date Range.
Calculation: Monthly Average Parts Purchases = Total Parts Purchases Received on PO Receipts during Date Range / 3
Example (based on Main Report image): Monthly Average Parts Purchases = $173,310.12 Total Parts Purchases Received on PO Receipts during Date Range / 3 = $57,770 (rounded to nearest integer) Note: To see the PO Receipt details on which this number is based, see the Inventory Purchased Details (Item Level) sub report. To get the exact monetary amount of parts purchased, export the Inventory Purchased Details (Item Level) sub report data to an Excel file, sort the rows by the Part/Supply column (Column C), and sum the Cost column (Column H) for the Part rows.
|
|
|
The total parts used on service calls, sales orders, and production work orders for items included in the report based on your Define Parts parameter during the Date Range you specified for the report divided by 3. Note: This calculation will only be accurate if you use a three-month Date Range.
Calculation: Monthly Average Parts Used = Total Parts Used on Service Calls, Sales Orders, and Production Work Orders during Date Range / 3
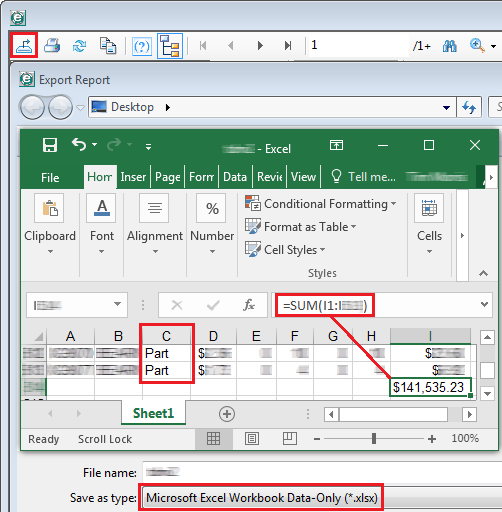
Example (based on Main Report image): Monthly Average Parts Used = $141,535.23 Total Parts Used on Service Calls, Sales Orders, and Production Work Orders during Date Range / 3 = $47,178 (rounded to nearest integer) Note: To see the usage details on which this number is based, see the Inventory Usage Details sub report. To get the exact monetary amount of parts purchased, export the Inventory Usage Details sub report data to an Excel file, sort the rows by the Part/Supply column (Column C), and sum the Cost column (Column I) for the Part rows.
|
|
|
The surplus inventory or inventory shortage based on subtracting the Monthly Average Parts Used from the Monthly Average Parts Purchases. Calculation: Excess/Shortfall (Parts) = Monthly Average Parts Purchases - Monthly Average Parts Used
Example (based on Main Report image): Excess/Shortfall (Parts) = $57,770.04 Monthly Average Parts Purchases - $47,178.41 Monthly Average Parts Used = $10,592 (rounded to nearest integer) Excess (Parts) |
|
|
The total supply purchases for items included in the report based on your Define Supplies parameter as received on PO Receipts during the Date Range you specified for the report divided by 3. Note: This calculation will only be accurate if you use a three-month Date Range.
Calculation: Monthly Average Supply Purchases = Total Supply Purchases Received on PO Receipts during Date Range / 3
Example (based on Main Report image): Monthly Average Supply Purchases = $317,605.18 Total Supply Purchases Received on PO Receipts during Date Range / 3 = $105,868 (rounded to nearest integer) Note: To see the PO Receipt details on which this number is based, see the Inventory Purchased Details (Item Level) sub report. To get the exact monetary amount of supplies purchased, export the Inventory Purchased Details (Item Level) sub report data to an Excel file, sort the rows by the Part/Supply column (Column C), and sum the Cost column (Column H) for the Supply rows.

|
|
|
The total supplies used on service calls, sales orders, and production work orders for items included in the report based on your Define Supplies parameter during the Date Range you specified for the report divided by 3. Note: This calculation will only be accurate if you use a three-month Date Range.
Calculation: Monthly Average Supplies Used = Total Supplies Used on Service Calls, Sales Orders, and Production Work Orders during Date Range / 3
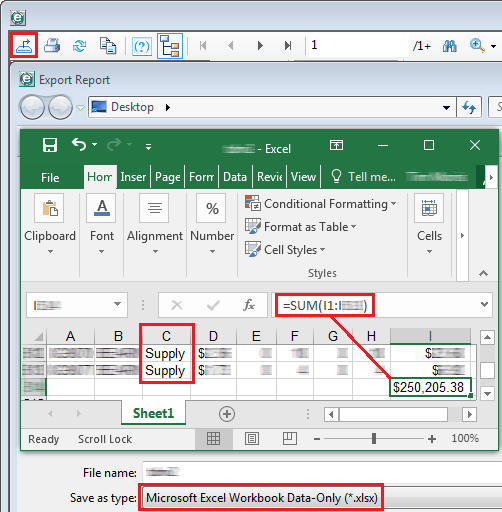
Example (based on Main Report image): Monthly Average Supplies Used = $250,205.38 Total Parts Used on Service Calls, Sales Orders, and Production Work Orders during Date Range / 3 = $83,402 (rounded to nearest integer) Note: To see the usage details on which this number is based, see the Inventory Usage Details sub report. To get the exact monetary amount of parts purchased, export the Inventory Usage Details sub report data to an Excel file, sort the rows by the Part/Supply column (Column C), and sum the Cost column (Column I) for the Supply rows.
|
|
|
The surplus inventory or inventory shortage based on subtracting the Monthly Average Supplies Used from the Monthly Average Supply Purchases. Calculation: Excess/Shortfall (Parts) = Monthly Average Supply Purchases - Monthly Average Supplies Used
Example (based on Main Report image): Excess/Shortfall (Supplies) = $105,868.39 Monthly Average Supply Purchases - $83,401.79 Monthly Average Supplies Used = $22,467 (rounded to nearest integer) Excess (Supplies) |
|
|
Dead Inventory Metrics |
|
|
The sum of the average costs of all items included in the report based on your Define Parts and Define Supplies parameters that have an on-hand quantity greater than 0 (zero) and that do not meet your Dead Inventory Use Months and Dead Inventory Receipt Months parameters for what constitutes dead inventory.
Calculation: Active Inventory Value = Sum(Average Cost of All Items Included in Report) - Sum(Average Cost of All Dead Inventory Items Included in Report)
Example (based on Main Report image using Dead Inventory Use Months = 18 months and Dead Inventory Receipt Months = 18 months): Active Inventory Value = $272,611.61 Average Cost of All Items Included in Report - $4,932.96 Average Cost of Dead Inventory Items Included in Report = $267,678.85 Note: To see how the system arrives at the Dead Inventory Value ($4,932.96) to subtract from the Current Inventory Value ($272,611.61) to calculate the Active Inventory Value ($267,678.85), see the Dead Inventory (Zero Inventory Turn) Details sub report.
|
|
|
The sum of the average costs of all items included in the report based on your Define Parts and Define Supplies parameters that meets your Dead Inventory Use Months and/or Dead Inventory Receipt Months parameters for what constitutes dead inventory.
Calculation: Dead Inventory Value = Sum(Average Cost of All Dead Inventory Items Included in Report)
Example (based on Main Report image using Dead Inventory Use Months = 18 months and Dead Inventory Receipt Months = 18 months): Dead Inventory Value = $4,932.96 Average Cost of Dead Inventory Items Included in Report Note: To see how the system arrives at the Dead Inventory Value ($4,932.96), see the Dead Inventory (Zero Inventory Turn) Details sub report. To get the exact monetary amount of the Dead Inventory Value, export the Dead Inventory (Zero Inventory Turn) Details sub report data to an Excel file and sum the Cost column (Column E).
|
|
|
The total inventory average cost (inventory quantity * average cost) of the items included in the Define Parts and Define Supplies parameters you specified for the report.
Calculation: Current Inventory Value = Sum(Inventory Quantity * Average Cost for Each Item Included in Report)
Example (based on Main Report image): Current Inventory Value = $272,612. Note: To see how the system arrives at this value ($272,612 in the sample image), see the Dealer Inventory Cost Details sub report. To get the exact monetary amount of the Current Inventory Value ($272,611.61), export the Dealer Inventory Cost Details sub report data to an Excel file, multiply the Quantity column (Column D) by the Average Cost column (Column F) and store the results in Column J, and then sum Column J.
|
|
|
The percentage of the inventory included in the report based on the Define Parts and Define Supplies parameters within the specified Date Range that meets your Dead Inventory Use Months and/or Dead Inventory Receipt Months parameters for what constitutes dead inventory. Calculation: % at Dead Level = (Dead Inventory Value / Current Inventory Value)*100
Example (based on Main Report image using Dead Inventory Use Months = 18 months and Dead Inventory Receipt Months = 18 months): % at Dead Level = ($4,932.96 Dead Inventory Value / $272,611.61 Current Inventory Value)*100 = 2% (rounded to no decimal positions) |
|
|
Rescheduled Service Call Metrics |
|
| The ratio of all calls marked incomplete during the specified Date Range to all calls completed during the specified Date Range.
Calculation: Current Reschedule % = (Incompleted Service Calls / Completed Service Calls)*100
Example (based on Main Report image): Current Reschedule % = (486 Incompleted Service Calls / 4,059 Completed Service Calls)*100 = 12% (rounded to no decimal positions) |
|
|
The ratio of all calls marked incomplete during the specified Date Range to all calls completed during the specified Date Range that you do not want to exceed. This value is the Target Reschedule Percentage parameter you specified for the report. The default value is 10%. |
|
|
The percentage of the difference between the Current Reschedule % and the Target Reschedule %. Calculation: Target Variance = ((Current Reschedule % - Target Reschedule %) / Current Reschedule %) * 100
Example (based on Main Report image and a Target Reschedule Percentage parameter value of 10%): Target Variance = ((0.119734 Current Reschedule % - 0.10 Target Reschedule %) /0.119734 Current Reschedule %) * 100 = 16% (rounded to no decimal positions) Note: A positive number indicates a variance above your target value, meaning the target percentage was not met. When the target percentage is not met, the system displays a
 in the Incomplete Service Calls row of the Service Call Information table on Page 3 of this report and performs calculations to determine how much your company could save if you were able to reduce the Current Reschedule % to the Target Reschedule %. A negative number indicates a variance below your target value, meaning the target percentage was met. When the target percentage is met, the system displays a in the Incomplete Service Calls row of the Service Call Information table on Page 3 of this report and performs calculations to determine how much your company could save if you were able to reduce the Current Reschedule % to the Target Reschedule %. A negative number indicates a variance below your target value, meaning the target percentage was met. When the target percentage is met, the system displays a  in the Incomplete Service Calls row of the Service Call Information table on Page 3 of this report and sets to zero any calculations that would otherwise be used to determine how much your company could save by reducing your Current Reschedule % since this value is already below the Target Reschedule %. in the Incomplete Service Calls row of the Service Call Information table on Page 3 of this report and sets to zero any calculations that would otherwise be used to determine how much your company could save by reducing your Current Reschedule % since this value is already below the Target Reschedule %. |
|
|
The monthly cost of rescheduled service calls based on the average service call duration and the Rescheduled Hour Cost parameter you specified for the report. Calculation: Current R/S Cost @ [Rate] per Hour: ((Number of Incomplete Service Calls * Average Call Duration * Rescheduled Hour Cost) / Number of Months in Date Range
Example (based on Main Report image and a Rescheduled Hour Cost value of $65.00): Current R/S Cost @ $65.00 per Hour: ((486 Incomplete Service Calls * 1.810875 Hours Average Call Duration * $65.00 Rescheduled Hour Cost) / 3 Months in Date Range = $19,069 (rounded to nearest integer) |
|
|
The monthly cost of rescheduled service calls based on the average service call duration and the Rescheduled Hour Cost parameter you specified for the report that you do not want to exceed. Calculation: Target R/S Cost @ [Rate] per Hour = (((Number of Incomplete Service Calls * Average Call Duration) - R/S Hours Reduction) * Rescheduled Hour Cost) / Number of Months in Date Range
Example (based on Main Report image and a Rescheduled Hour Cost value of $65.00): Target R/S Cost @ $65.00 per Hour = (((486 Incomplete Service Calls * 1.810875 Hours Average Call Duration) - 95.906874 R/S Hours Reduction) * $65.00 Rescheduled Hour Cost) / 3 Months in Date Range = $16,991 (rounded to nearest integer) Note: See the R/S Hours Reduction section below to see how the R/S Hours Reduction amount was calculated.
Note: If your Target Variance is negative (indicating the current rescheduled call percentage is below the target rescheduled call percentage you specified for the report), the system will set this amount to $0.
|
|
|
The monthly cost difference of your technicians' customer and travel time between rescheduled service calls at your Current Reschedule % and your Target Reschedule %. Calculation: R/S Customer /Travel Cost Reduction = Current R/S Cost @ [Rate] per Hour - Target R/S Cost @ [Rate] per Hour
Example (based on Main Report image and a Rescheduled Hour Cost value of $65.00): R/S Customer /Travel Cost Reduction = $19,608.51375 Current R/S Cost @ $65.00 per Hour - $16,990.531458 Target R/S Cost @ $65.00 per Hour = $2,078 (rounded to nearest integer, and also displayed at the bottom of this column with two decimal positions—$2,077.98). Note: A value greater than zero indicates the monthly cost of your technicians' customer and travel time you could save per month if you could reduce your Current Reschedule % to your Target Reschedule %. If your Target Variance is negative (indicating the current rescheduled call percentage is below the target rescheduled call percentage you specified for the report), the system will set this amount to $0.00.
|
|
|
Labor Impact of Rescheduled Service Calls |
|
|
The total customer time plus the total travel time difference between the rescheduled calls at your Current Reschedule % and the rescheduled calls at your specified Target Reschedule Percentage.
Calculation: Potential Labor Hours to Recapture = Number of Incomplete Service Calls * ( ( ( Number of Incomplete Service Calls / Number of Closed Service Calls ) - Target Reschedule Percentage) / Target Reschedule Percentage)
Example (based on Main Report image): Potential Labor Hours to Recapture = 486 Incomplete Service Calls * ( ( ( 486 Incomplete Service Calls / 4,059 Closed Service Calls ) - .10 Target Reschedule Percentage) /.10 Target Reschedule Percentage) = 95.9 (rounded to one decimal position) Note: A value greater than zero indicates the number of technician hours your Current Reschedule % is above your Target Reschedule %. If your Target Variance is negative (indicating the current rescheduled call percentage is below the target rescheduled call percentage you specified for the report), the system will set this amount to 0.0.
|
|
|
The number of potential technicians you could save per month if you could reduce your Current Reschedule % to your Target Reschedule Percentage. The calculation is based on multiplying the number of labor hours you could recapture by the Monthly Technician Hours parameter you specified for the report.
Calculation: Potential Technicians (Monthly) = Potential Labor Hours to Recapture / Monthly Technician Hours
Example (based on Main Report image and a Monthly Technician Hours value of 140): Potential Technicians (Monthly) = 95.906874 Potential Labor Hours to Recapture / 140 Monthly Technician Hours = 0.7 (rounded to one decimal position) Note: A value greater than zero indicates the number of technicians you could save per month if you could reduce your Current Reschedule % to your Target Reschedule %. If your Target Variance is negative (indicating the current rescheduled call percentage is below the target rescheduled call percentage you specified for the report), the system will set this amount to 0.0.
|
|
|
Calculations and/or Comparison of Actual Values to Target Values |
|
|
Total average cost value of items included in the report based on your Define Parts and Define Supplies parameters that were used on service calls, sales orders, and production work orders divided by 3, then divided by the current inventory value, and then multiplied by 12.
Calculation: Current Inventory Turns = ((Total Average Cost of Items Included in Report that Were Used During Report Date Range on Service Calls, Sales Orders, and/or Production Work Order / 3) / Current Inventory Value Based on Average Cost) * 12
Example (based on Main Report image): Current Inventory Turns = (($391,740.61 Total Average Cost of Items Included in Report that Were Used During Report Date Range on Service Calls, Sales Orders, and/or Production Work Order / 3) / 272,611.61 Current Inventory Value) * 12 = 5.7 (rounded to one decimal position) Note: To see how the system arrives at the Total Average Cost Amount, see the Inventory Usage table on Report Page 3 and/or the Inventory Usage Details sub report. This value is the sum of the Parts Usage ($141,535.23) and Supply Usage ($250,205.38) amounts, which equals $391,740.61. To see how the system arrives at the Current Inventory Value Based on Average Cost ($272,611.61), see the Dealer Inventory Cost Details sub report.
|
|
|
The report's industry standard target number of inventory turns (i.e., 3.0). |
|
|
The percentage of the inventory included in the report based on the Define Parts and Define Supplies parameters within the specified Date Range that meets your Dead Inventory Use Months and/or Dead Inventory Receipt Months parameters for what constitutes dead inventory. Calculation: "Dead" Inventory % (Dealer) = (Dead Inventory Value / Current Inventory Value)*100
Example (based on Main Report image using Dead Inventory Use Months = 18 months and Dead Inventory Receipt Months = 18 months): "Dead" Inventory % (Dealer) = ($4,932.96 Dead Inventory Value / $272,611.61 Current Inventory Value)*100 = 1.8% (rounded to one decimal positions) |
|
|
The report's industry standard target percentage of inventory that constitutes dead inventory (i.e., 10%). |
|
|
The ratio of all calls marked incomplete during the specified Date Range to all calls completed during the specified Date Range. Calculation: Incomplete Call % (Dealer) = (Incompleted Service Calls / Completed Service Calls)*100
Example (based on Main Report image): Incomplete Call % (Dealer) = (486 Incompleted Service Calls / 4,059 Completed Service Calls)*100 = 12.0% (rounded to one decimal position) |
|
|
The ratio of all calls marked incomplete during the specified Date Range to all calls completed during the specified Date Range that you do not want to exceed. This value is the Target Reschedule Percentage parameter you specified for the report. The default value is 10.0%. |
|
|
The percentage of the difference between the Current Reschedule % and the Target Reschedule %. Calculation: Excess R/S Percentage Above Target (Dealer) = ((Current Reschedule % -Target Reschedule %) / Current Reschedule %) * 100
Example (based on Main Report image and a Target Reschedule Percentage parameter value of 10%): Excess R/S Percentage Above Target (Dealer) = ((0.119734 Current Reschedule % - 0.10 Target Reschedule %) /0.119734 Current Reschedule %) * 100 = 16.5% (rounded to one decimal position) |
|
|
The total Labor Hours plus the total Overtime Hours minus the total Interrupt Hours plus the Travel Hours spent on all service calls that were closed during the report's Date Range.
Calculation: Total Cust & Travel Hours (Dealer) = SUM(Labor Hours) + SUM(Overtime Hours) - SUM(Interrupt Hours) + SUM(Travel Hours)
Example (based on Main Report image): Total Cust & Travel Hours (Dealer) = 5,710.9178 Labor Hours + 82.4006 Overtime Hours - 58 Interrupt Hours + 1,615.0241 Hours = 7,350.3 Hours (rounded to one decimal position) Note: While you can export the data from the Service Call Details sub report, the main report lists this data more precisely (an extra decimal point of precision) than the export file does. Due to rounding, the exported data may not match the report's data exactly. If you customize the Service Calls (Invoiced) Labor e-view to include the Interrupt Hours column, the Call Close Date filter, and the SUM Interrupt Hours function, you can perform a QuickSearch using the Call Close Date filter, selecting is in the range, and entering a date range equal to your report's Date Range, subtracting one day from the last day of the date range.
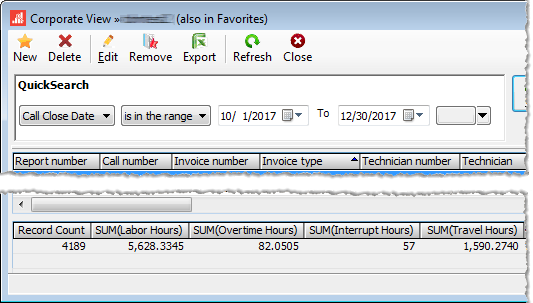 If you choose to export the data from the Service Call Details sub report, you will need to manipulate the data to get it into a useful format for summing the hourly values (e.g., export the data as a .csv file, delete the leading commas at the beginning of each row, delete the hour labels such as "Total Labor Hours: " in each cell containing hourly values, and then sum the values in each column containing hourly values). In the sample image below, Columns H-L represent the Labor, Overtime, Interrupt, Travel, and Total Hours, respectively. 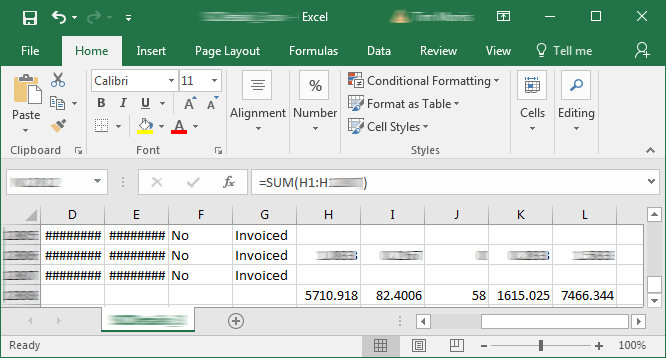
|
|
|
The total Labor Hours plus the total Overtime Hours minus the total Interrupt Hours plus the Travel Hours spent on all service calls that were closed during the report's Date Range multiplied by the Rescheduled Hour Cost parameter you specified for the report.
Calculation: Hours Cost @ [Rate] (Dealer) = Total Cust & Travel Hours (Dealer) * Rescheduled Hour Cost
Example (based on Main Report image): Hours Cost @ $65.00 (Dealer) = 7,350.3425 Total Cust & Travel Hours (Dealer) * $65.00 = $477,772 (rounded to the nearest integer) |
|
|
The three-month number of rescheduled service call hours. Calculation: Current R/S Hours (Dealer) = Number of Incomplete Service Calls * Average Call Duration
Example (based on Main Report image): Current R/S Hours (Dealer) = 486 Incomplete Service Calls * 1.810875 Average Call Duration = 880.1 Hours (rounded to one decimal position) |
|
|
The three-month target number of rescheduled service call hours. Calculation: Current R/S Hours (Target) = (Number of Incomplete Service Calls * Average Call Duration) - R/S Hours Reduction
Example (based on Main Report image): Current R/S Hours (Target) = (486 Incomplete Service Calls * 1.810875 Hours Average Call Duration) - 95.906874 R/S Hours Reduction = 784.2 Hours (rounded to one decimal position) Note: See the R/S Hours Reduction section to see how the R/S Hours Reduction amount was calculated.
Note: If your Target Variance is negative (indicating the current rescheduled call percentage is below the target rescheduled call percentage you specified for the report), the system will set this amount to 0.0.
|
|
|
The three-month cost of rescheduled service calls based on the average service call duration and the Rescheduled Hour Cost parameter you specified for the report. Calculation: R/S Cost @ [Rate] per Hour = Number of Incomplete Service Calls * Average Call Duration * Rescheduled Hour Cost
Example (based on Main Report image and a Rescheduled Hour Cost value of $65.00): R/S Cost @ $65.00 per Hour = 486 Incomplete Service Calls * 1.810875 Hours Average Call Duration * $65.00 Rescheduled Hour Cost = $57,206 (rounded to nearest integer) Note: If your Target Variance is negative (indicating the current rescheduled call percentage is below the target rescheduled call percentage you specified for the report), the system will set this amount to $0.
|
|
|
The three-month cost of rescheduled service calls based on the average service call duration and the Rescheduled Hour Cost parameter you specified for the report that you do not want to exceed. Calculation: Target R/S Cost @ [Rate] per Hour = (((Number of Incomplete Service Calls * Average Call Duration) - R/S Hours Reduction) * Rescheduled Hour Cost)
Example (based on Main Report image and a Rescheduled Hour Cost value of $65.00): Target R/S Cost @ $65.00 per Hour = (((486 Incomplete Service Calls * 1.810875 Hours Average Call Duration) - 95.906874 R/S Hours Reduction) * $65.00 Rescheduled Hour Cost) = $50,972 (rounded to nearest integer) Note: See the R/S Hours Reduction section to see how the R/S Hours Reduction amount was calculated.
Note: If your Target Variance is negative (indicating the current rescheduled call percentage is below the target rescheduled call percentage you specified for the report), the system will set this amount to 0.0.
|
|
|
The total customer time plus the total travel time difference between the rescheduled calls at your Current Reschedule % and the rescheduled calls at your specified Target Reschedule Percentage.
Calculation: Projected Reduction in R/S Hours (Target) = Number of Incomplete Service Calls * ( ( ( Number of Incomplete Service Calls / Number of Closed Service Calls ) - Target Reschedule Percentage) / Target Reschedule Percentage)
Example (based on Main Report image): Projected Reduction in R/S Hours (Target) = 486 Incomplete Service Calls * ( ( ( 486 Incomplete Service calls / 4,059 Closed Service Calls ) - .10 Target Reschedule Percentage) /.10 Target Reschedule Percentage) = 95.9 Hours (rounded to one decimal position) Note: A number greater than zero indicates the number of technician hours your Current Reschedule % is above your Target Reschedule Percentage. If your Target Variance is negative (indicating the current rescheduled call percentage is below the target rescheduled call percentage you specified for the report), the system will set this amount to $0.
|
|
|
The cost of the total customer time plus the total travel time difference between the rescheduled calls at your Current Reschedule % and the rescheduled calls at your specified Target Reschedule Percentage.
Calculation: Projected Reduction in R/S Hour Costs (Target) = Projected Reduction in Reschedule Call Hours * Rescheduled Hour Cost
Example (based on Main Report image and a Rescheduled Hour Cost value of $65.00): Projected Reduction in R/S Hour Costs (Target) = 95.906874 Projected Reduction in Reschedule Call Hours * $65.00 Rescheduled Hour Cost = $6,234 (rounded to nearest integer) |
|
|
The total customer time plus the travel time divided by the total number of service calls completed during the Date Range you specified for the report. Calculation: Average Call Duration (Dealer) = (Total Customer Time * Total Travel Time) / Number of Completed Service Calls in Date Range
Example (based on Main Report image): Average Call Duration (Dealer) = (5,735.32 Total Customer Time + 1,615.02 Total Travel Time) / 4,059 Completed Service Calls = 1.8 (rounded to one decimal position) |
|
|
Dealer Inventory Cost |
|
|
The sample report received the |
|
|
The total inventory current cost (inventory quantity * current cost) of the items included in the Define Parts and Define Supplies parameters you specified for the report. Note: The current cost used in this report is not the current cost of the item as recorded in e-automate. For more information, see the Current Cost Origin listing in this table.
Calculation: Inventory Current Cost = Sum(Inventory Quantity * Current Cost for Each Item Included in Report)
Example (based on Main Report image): Inventory Average Cost = $272,630.18 Note: To see how the system arrives at this value ($272,612 in the sample image), see the Dealer Inventory Cost Details sub report. To get the exact monetary amount of the Average Inventory Cost ($272,630.18), export the Dealer Inventory Cost Details sub report data to an Excel file, multiply the Quantity column (Column D) by the Current Cost column (Column E) and store the results in Column J, and then sum Column J.
|
|
|
The sample report received the |
|
|
The total inventory average cost (inventory quantity * average cost) of the items included in the Define Parts and Define Supplies parameters you specified for the report.
Calculation: Inventory Average Cost = Sum(Inventory Quantity * Average Cost for Each Item Included in Report)
Example (based on Main Report image): Inventory Average Cost = $272,611.61 Note: To see how the system arrives at this value ($272,611.61 in the sample image), see the Dealer Inventory Cost Details sub report. To get the exact monetary amount of the Average Inventory Cost ($272,611.61), export the Dealer Inventory Cost Details sub report data to an Excel file, multiply the Quantity column (Column D) by the Average Cost column (Column F) and store the results in Column J, and then sum Column J.
|
|
|
Inventory Purchased |
|
|
The sample report received the |
|
|
The total parts purchases for items included in the report based on your Define Parts parameter as received on PO Receipts during the Date Range you specified for the report. Calculation: Parts Purchases (Value) = SUM(Parts Purchases Received on PO Receipts during Date Range)
Example (based on Main Report image): Parts Purchases (Value) = $173,310.12 Note: To see the PO Receipt details on which this number is based, see the Inventory Purchased Details (Item Level) sub report. To get the exact monetary amount of parts purchased, export the Inventory Purchased Details (Item Level) sub report data to an Excel file, sort the rows by the Part/Supply column (Column C), and sum the Cost column (Column H) for the Part rows.
|
|
|
The sample report received the |
|
|
The total supply purchases for items included in the report based on your Define Supplies parameter as received on PO Receipts during the Date Range you specified for the report. Calculation: Supplies Purchased (Value) = SUM(Supply Purchases Received on PO Receipts during Date Range)
Example (based on Main Report image): Supplies Purchased (Value) = $317,605.18 Note: To see the PO Receipt details on which this number is based, see the Inventory Purchased Details (Item Level) sub report. To get the exact monetary amount of supplies purchased, export the Inventory Purchased Details (Item Level) sub report data to an Excel file, sort the rows by the Part/Supply column (Column C), and sum the Cost column (Column H) for the Supply rows.
|
|
|
Zero Turn Inventory |
|
|
The sample report received the |
|
|
The sum of the average costs of all items included in the report based on your Define Parts and Define Supplies parameters that do not meet your Dead Inventory Use Months and/or Dead Inventory Receipt Months parameters for what constitutes dead inventory.
Calculation: Active Inventory Value = Inventory Average Cost of All Items Included in Report - Average Cost of Dead Inventory Items Included in Report
Example (based on Main Report image): Active Inventory Value = $272,611.61 Inventory Average Cost of All Items Included in Report - $4,932.96 Average Cost of Dead Inventory Items Included in Report = $267,678.65 Note: To see how the system calculates Dead Inventory Value, see the "Dead" Inventory Value
(Value) section below. |
|
|
The sample report received the |
|
|
The sum of the average costs of all items included in the report based on your Define Parts and Define Supplies parameters that meets your Dead Inventory Use Months and/or Dead Inventory Receipt Months parameters for what constitutes dead inventory.
Calculation: Dead Inventory Value = Sum(Average Cost of All Dead Inventory Items Included in Report)
Example (based on Main Report image using Dead Inventory Use Months = 18 months and Dead Inventory Receipt Months = 18 months): Dead Inventory Value = $4,932.96 Average Cost of Dead Inventory Items Included in Report Note: To see how the system arrives at the Dead Inventory Value ($4,932.96), see the Dead Inventory (Zero Inventory Turn) Details sub report. To get the exact monetary amount of the Dead Inventory Value, export the Dead Inventory (Zero Inventory Turn) Details sub report data to an Excel file and sum the Cost column (Column E).
|
|
|
Inventory Usage |
|
|
|
|
|
The total parts used on service calls, sales orders, and production work orders for items included in the report based on your Define Parts parameter during the Date Range you specified for the report. Calculation: Parts Usage (Value) = SUM( Parts Used on Service Calls, Sales Orders, and Production Work Orders during Date Range)
Example (based on Main Report image): Parts Usage (Value) = $141,535.23 Note: To see the usage details on which this number is based, see the Inventory Usage Details sub report. To get the exact monetary amount of parts purchased, export the Inventory Usage Details sub report data to an Excel file, sort the rows by the Part/Supply column (Column C), and sum the Cost column (Column I) for the Part rows.
|
|
|
|
|
|
The total supplies used on service calls, sales orders, and production work orders for items included in the report based on your Define Supplies parameter during the Date Range you specified for the report. Calculation: Supply Usage (Value) = SUM(Supplies Used on Service Calls, Sales Orders, and Production Work Orders during Date Range)
Example (based on Main Report image): Supply Usage (Value) = $250,205.38 Note: To see the usage details on which this number is based, see the Inventory Usage Details sub report. To get the exact monetary amount of parts purchased, export the Inventory Usage Details sub report data to an Excel file, sort the rows by the Part/Supply column (Column C), and sum the Cost column (Column I) for the Supply rows.
|
|
|
Service Call Information |
|
|
|
|
|
The total number of service calls marked complete during the Date Range you specified for the report. The example image shows 4,059 calls were marked complete during the October 1 to December 31 report date range. Note: For a complete list of these service calls, see the Service Call Details sub report.
|
|
|
The sample report received the |
|
|
The total number of service calls marked incomplete during the Date Range you specified for the report. The example image shows 486 calls were marked incomplete during the October 1 to December 31 report date range. Note: For details, see the Service Call Details sub report.
|
|
|
|
|
|
The total Labor Hours plus the total Overtime Hours minus the total Interrupt Hours spent on all service calls that were closed during the report's Date Range.
Calculation: Customer Hours = SUM(Labor Hours) + SUM(Overtime Hours) - SUM(Interrupt Hours)
Example (based on Main Report image): Customer Hours = 5,710.9178 Labor Hours + 82.4006 Overtime Hours - 58 Interrupt Hours = 5,735.32 Hours (rounded to two decimal positions) Note: While you can export the data from the Service Call Details sub report, the main report lists this data more precisely (an extra decimal point of precision) than the export file does. Due to rounding, the exported data may not match the report's data exactly. If you customize the Service Calls (Invoiced) Labor e-view to include the Interrupt Hours column, the Call Close Date filter, and the SUM Interrupt Hours function, you can perform a QuickSearch using the Call Close Date filter, selecting is in the range, and entering a date range equal to your report's Date Range, subtracting one day from the last day of the date range.
If you choose to export the data from the Service Call Details sub report, you will need to manipulate the data to get it into a useful format for summing the hourly values (e.g., export the data as a .csv file, delete the leading commas at the beginning of each row, delete the hour labels such as "Total Labor Hours: " in each cell containing hourly values, and then sum the values in each column containing hourly values). In the sample image below, Columns H-L represent the Labor, Overtime, Interrupt, Travel, and Total Hours, respectively.
|
|
|
|
|
|
The total Travel Hours spent on all service calls that were closed during the report's Date Range.
Calculation: Travel Hours = SUM(Travel Hours)
Example (based on Main Report image): Travel Hours = 1,615.02 Hours (rounded to two decimal positions) Note: While you can export the data from the Service Call Details sub report (where values are rounded to four decimal positions), the values in the main report are calculated using additional decimal positions. Due to rounding, the exported data may not match the report's data exactly. If you customize the Service Calls (Invoiced) Labor e-view to include the Call Close Date filter, you can perform a QuickSearch using the Call Close Date filter, selecting is in the range, and entering a date range equal to your report's Date Range.
If you choose to export the data from the Service Call Details sub report, you will need to manipulate the data to get it into a useful format for summing the hourly values (e.g., export the data as a .csv file, delete the leading commas at the beginning of each row, delete the hour labels such as "Total Labor Hours: " in each cell containing hourly values, and then sum the values in each column containing hourly values). In the sample image below, Columns H-L represent the Labor, Overtime, Interrupt, Travel, and Total Hours, respectively.
|
|
|
Summary Information |
|
|
The percentage of rescheduled service calls above the Target Reschedule Percentage you specified for the report. Calculation: Excess R/S Call Percentage = Incomplete Service Calls / (Total Service Calls - Target Reschedule Percentage) * 100
Example (based on Main Report image and a Target Reschedule Percentage of 10%): Excess R/S Call Percentage = ((486 Incomplete Service Calls / 4,059 Total Service Calls) - .10 Target Reschedule Percentage) * 100 = 2% (rounded to no decimal positions) |
|
|
The total customer time plus the travel time divided by the total number of service calls completed during the Date Range you specified for the report. Calculation: Average Call Duration = (Total Customer Time * Total Travel Time) / Number of Completed Service Calls in Date Range
Example (based on Main Report image): Average Call Duration = (5,735.32 Total Customer Time + 1,615.02 Total Travel Time) / 4,059 Completed Service Calls = 1.81 (rounded to two decimal positions) |
|
|
Additional Information |
|
|
The total customer time plus the total travel time difference between the rescheduled calls at your Current Reschedule % and the rescheduled calls at your specified Target Reschedule Percentage.
Calculation: R/S Hours Reduction = Number of Incomplete Service Calls * ( ( ( Number of Incomplete Service Calls / Number of Closed Service Calls ) - Target Reschedule Percentage) / Target Reschedule Percentage)
Example (based on Main Report image): R/S Hours Reduction = 486 Incomplete Service Calls * ( ( ( 486 Incomplete Service calls / 4,059 Closed Service Calls ) - .10 Target Reschedule Percentage) /.10 Target Reschedule Percentage) = 95.9 (rounded to one decimal position) Note: A number greater than zero indicates the number of technician hours your Current Reschedule % is above your Target Reschedule Percentage. If your Target Variance is negative (indicating the current rescheduled call percentage is below the target rescheduled call percentage you specified for the report), the system will set this amount to 0.0.
|
|
|
The rescheduled service call hours at your Target Reschedule Percentage.
Calculation: R/S Hours @ [Rate] % R/S = (Number of Incomplete Service Calls * Average Call Duration) - R/S Hours Reduction
Example (based on Main Report image): R/S Hours @ [Rate] % R/S = (486 Incomplete Service Calls * 1.810875 Hours Average Call Duration) - 95.906874 R/S Hours Reduction = 784.2 (rounded to one decimal position) Note: See the R/S Hours Reduction section to see how the R/S Hours Reduction amount was calculated.
Note: If your Target Variance is negative (indicating the current rescheduled call percentage is below the target rescheduled call percentage you specified for the report), the system will set this amount to 0.0.
|
|
Dealer Inventory Cost Details Sub ReportDealer Inventory Cost Details Sub Report
Following is a sample Dealer Inventory Scorecard Report's Dealer Inventory Cost Details sub report.
The following table explains how the data in the Dealer Inventory Cost Details sub report is used to calculate the amounts displayed in the main report.
Inventory Purchased Details Sub ReportsInventory Purchased Details Sub Reports
Inventory Purchased Details (Item-level) Sub ReportInventory Purchased Details (Item-level) Sub Report
Following is a sample Dealer Inventory Scorecard Report's Inventory Purchased Details (Item-level) sub report.
The following table explains how the data in the Inventory Purchased Details (Item-level) sub report is used to calculate amounts displayed on the main report.
|
Report Label |
Description and/or Calculation |
|
Summary Table |
|
|
The number of distinct stocked inventory item numbers included in the Define Parts parameter you specified for the report that were included on Purchase Order Receipts during the report's Date Range (in the sample report, 534 Part items). The Inventory Purchased Details (Item-level) sub report includes one row per part, and items (Parts and Supplies) are sequenced by Item Number. |
|
|
The number of stocked inventory items included in the Define Parts parameter you specified for the report for which the difference between the Maximum Purchase Price and the Minimum Purchase Price of an item on Purchase Order Receipts during the report's Date Range is equal to 0 (zero) percent of the Average Purchase Price on Purchase Order Receipts during the report's Date Range.
Calculation: % of Diff. = 0% (Parts Count) = Sum(Items Where Supply or Part column = Part and % of Diff. column = 0%)
Example (based on Inventory Purchased Details (Item-level) sub report image): % of Diff. = 0% (Parts Count) = Sum(Items P001 and 514 other Items not shown in the sample image) = 515
Note: To see how the % of Diff. is calculated for each item, see the Dealer Inventory Scorecard Report's Inventory Purchased Details (Transaction-level) sub report.
|
|
|
The ratio of the % of Diff. = 0% (Parts Count) to the Total Parts Purchases.
Calculation: % of Diff. = 0% (Parts Percentage) = (% of Diff. = 0% (Parts Count) / Total Parts Purchases) * 100
Example (based on Dealer Inventory Cost Details image): % of Diff. = 0% (Parts Percentage) = (515 % of Diff. = 0% (Parts Count) / 534 Total Parts Purchases) * 100 = 96% (rounded to no decimal positions) |
|
|
The number of stocked inventory items included in the Define Parts parameter you specified for the report for which the difference between the Maximum Purchase Price and the Minimum Purchase Price of an item on Purchase Order Receipts during the report's Date Range is greater than 0 (zero) percent and less than 25 percent of the Average Purchase Price on Purchase Order Receipts during the report's Date Range.
Calculation: % of Diff. > 0% and < 25% (Parts Count) = Sum(Items Where Supply or Part column = Part and % of Diff. column > 0% and < 25%)
Example (based on Inventory Purchased Details (Item-level) sub report image): % of Diff. > 0% and < 25% (Parts Count) = Sum(Item P002 and 2 other Items not shown in the sample image) = 3
Note: To see how the % of Diff. is calculated for each item, see the Dealer Inventory Scorecard Report's Inventory Purchased Details (Transaction-level) sub report.
|
|
|
The ratio of the % of Diff. > 0% and < 25% (Parts Count) to the Total Parts Purchases.
Calculation: % of Diff. > 0% and < 25% (Parts Percentage) = (% of Diff. > 0% and < 25% (Parts Count) / Total Parts Purchases) * 100
Example (based on Inventory Purchased Details (Item-level) sub report image): % of Diff. > 0% and < 25% (Parts Percentage) = (3 % of Diff. > 0% and < 25% (Parts Count) / 534 Total Parts Purchases) * 100 = 1% (rounded to no decimal positions) |
|
|
The number of stocked inventory items included in the Define Parts parameter you specified for the report for which the difference between the Maximum Purchase Price and the Minimum Purchase Price of an item on Purchase Order Receipts during the report's Date Range is greater than or equal to 25 percent and less than 50 percent of the Average Purchase Price on Purchase Order Receipts during the report's Date Range.
Calculation: % of Diff. >= 25% and < 50% (Parts Count) = Sum(Items Where Supply or Part column = Part and % of Diff. column >= 25% and < 50%)
Example (based on Inventory Purchased Details (Item-level) sub report image): % of Diff. >= 25% and < 50% (Parts Count) = Sum(3 Items not shown in the sample image) = 3
Note: To see how the % of Diff. is calculated for each item, see the Dealer Inventory Scorecard Report's Inventory Purchased Details (Transaction-level) sub report.
|
|
|
The ratio of the % of Diff. >= 25% and < 50% (Parts Count) to the Total Parts Purchases.
Calculation: % of Diff. >= 25% and < 50% (Parts Percentage) = (% of Diff. >= 25% and < 50% (Parts Count) / Total Parts Purchases) * 100
Example (based on Inventory Purchased Details (Item-level) sub report image): % of Diff. >= 25% and < 50% (Parts Percentage) = (3 % of Diff. >= 25% and < 50% (Parts Count) / 534 Total Parts Purchases) * 100 = 1% (rounded to no decimal positions) |
|
|
The number of stocked inventory items included in the Define Parts parameter you specified for the report for which the difference between the Maximum Purchase Price and the Minimum Purchase Price of an item on Purchase Order Receipts during the report's Date Range is greater than or equal to 50 percent and less than 100 percent of the Average Purchase Price on Purchase Order Receipts during the report's Date Range.
Calculation: % of Diff. >= 50% and < 100% (Parts Count) = Sum(Items Where Supply or Part column = Part and % of Diff. column >= 50% and < 100%)
Example (based on Inventory Purchased Details (Item-level) sub report image): % of Diff. >= 50% and < 100% (Parts Count) = Sum(0 Items) = 0
Note: To see how the % of Diff. is calculated for each item, see the Dealer Inventory Scorecard Report's Inventory Purchased Details (Transaction-level) sub report.
|
|
|
The ratio of the % of Diff. >= 25% and < 50% (Parts Count) to the Total Parts Purchases.
Calculation: % of Diff. >= 50% and < 100% (Parts Percentage) = (% of Diff. >= 50% and < 100% (Parts Count) / Total Parts Purchases) * 100
Example (based on Inventory Purchased Details (Item-level) sub report image): % of Diff. >= 50% and < 100% (Parts Percentage) = (0 % of Diff. >= 50% and < 100% (Parts Count) / 534 Total Parts Purchases) * 100 = 0% |
|
|
The number of stocked inventory items included in the Define Parts parameter you specified for the report for which the difference between the Maximum Purchase Price and the Minimum Purchase Price of an item on Purchase Order Receipts during the report's Date Range is greater than or equal to 100 percent of the Average Purchase Price on Purchase Order Receipts during the report's Date Range.
Calculation: % of Diff. >= 100% (Parts Count) = Sum(Items Where Supply or Part column = Part and % of Diff. column >= 25% and < 50%)
Example (based on Inventory Purchased Details (Item-level) sub report image): % of Diff. >= 100% (Parts Count) = Sum(13 Items not shown in the sample image) = 13
Note: To see how the % of Diff. is calculated for each item, see the Dealer Inventory Scorecard Report's Inventory Purchased Details (Transaction-level) sub report.
|
|
|
The ratio of the % of Diff. >= 100% (Parts Count) to the Total Parts Purchases.
Calculation: % of Diff. >= 100% (Parts Percentage) = (% of Diff. >= 100% (Parts Count) / Total Parts Purchases) * 100
Example (based on Inventory Purchased Details (Item-level) sub report image): % of Diff. >= 100% (Parts Percentage) = (13 % of Diff. >= 100% (Parts Count) / 534 Total Parts Purchases) * 100 = 2% (rounded to no decimal positions)
Note: To receive a Green Check (
) on Parts Purchases on Page 3 of the main Dealer Inventory Scorecard report, this percentage must be 0%. Since it is 2% for this sample report, the sample report received a red X () for Parts Purchases. |
|
|
The number of distinct stocked inventory item numbers included in the Define Supplies parameter you specified for the report that were included on Purchase Order Receipts during the report's Date Range (in the sample report, 321 Supply items). The Inventory Purchased Details (Item-level) sub report includes one row per supply, and items (Parts and Supplies) are sequenced by Item Number. |
|
|
The number of stocked inventory items included in the Define Supplies parameter you specified for the report for which the difference between the Maximum Purchase Price and the Minimum Purchase Price of an item on Purchase Order Receipts during the report's Date Range is equal to 0 (zero) percent of the Average Purchase Price on Purchase Order Receipts during the report's Date Range.
Calculation: % of Diff. = 0% (Supplies Count) = Sum(Items Where Supply or Part column = Supply and % of Diff. column = 0%)
Example (based on Inventory Purchased Details (Item-level) sub report image): % of Diff. = 0% (Supplies Count) = Sum(Items S003, S004, and 313 other Items not shown in the sample image) = 315
Note: To see how the % of Diff. is calculated for each item, see the Dealer Inventory Scorecard Report's Inventory Purchased Details (Transaction-level) sub report.
|
|
|
The ratio of the % of Diff. = 0% (Supplies Count) to the Total Supplies Purchases.
Calculation: % of Diff. = 0% (Supplies Percentage) = (% of Diff. = 0% (Supplies Count) / Total Supplies Purchases) * 100
Example (based on Inventory Purchased Details (Item-level) sub report image): % of Diff. = 0% (Supplies Percentage) = (315 % of Diff. = 0% (Supplies Count) / 321 Total Supplies Purchases) * 100 = 98% (rounded to no decimal positions) |
|
|
The number of stocked inventory items included in the Define Supplies parameter you specified for the report for which the difference between the Maximum Purchase Price and the Minimum Purchase Price of an item on Purchase Order Receipts during the report's Date Range is greater than 0 (zero) percent and less than 25 percent of the Average Purchase Price on Purchase Order Receipts during the report's Date Range.
Calculation: % of Diff. > 0% and < 25% (Supplies Count) = Sum(Items Where Supply or Part column = Supply and % of Diff. column > 0% and < 25%)
Example (based on Inventory Purchased Details (Item-level) sub report image): % of Diff. > 0% and < 25% (Supplies Count) = Sum(5 Items not shown in the sample image) = 5
Note: To see how the % of Diff. is calculated for each item, see the Dealer Inventory Scorecard Report's Inventory Purchased Details (Transaction-level) sub report.
|
|
|
The ratio of the % of Diff. > 0% and < 25% (Supplies Count) to the Total Supplies Purchases.
Calculation: % of Diff. > 0% and < 25% (Supplies Percentage) = (% of Diff. > 0% and < 25% (Supplies Count) / Total Supplies Purchases) * 100
Example (based on Inventory Purchased Details (Item-level) sub report image): % of Diff. > 0% and < 25% (Supplies Percentage) = (5 % of Diff. > 0% and < 25% (Supplies Count) / 321 Total Supplies Purchases) * 100 = 2% (rounded to no decimal positions) |
|
|
The number of stocked inventory items included in the Define Supplies parameter you specified for the report for which the difference between the Maximum Purchase Price and the Minimum Purchase Price of an item on Purchase Order Receipts during the report's Date Range is greater than or equal to 25 percent and less than 50 percent of the Average Purchase Price on Purchase Order Receipts during the report's Date Range.
Calculation: % of Diff. >= 25% and < 50% (Parts Count) = Sum(Items Where Supply or Part column = Supply and % of Diff. column >= 25% and < 50%)
Example (based on Inventory Purchased Details (Item-level) sub report image): % of Diff. >= 25% and < 50% (Parts Count) = Sum(0 Items) = 0
Note: To see how the % of Diff. is calculated for each item, see the Dealer Inventory Scorecard Report's Inventory Purchased Details (Transaction-level) sub report.
|
|
|
The ratio of the % of Diff. >= 25% and < 50% (Supplies Count) to the Total Supplies Purchases.
Calculation: % of Diff. >= 25% and < 50% (Supplies Percentage) = (% of Diff. >= 25% and < 50% (Supplies Count) / Total Supplies Purchases) * 100
Example (based on Inventory Purchased Details (Item-level) sub report image): % of Diff. >= 25% and < 50% (Supplies Percentage) = (0 % of Diff. >= 25% and < 50% (Supplies Count) / 321 Total Supplies Purchases) * 100 = 0% |
|
|
The number of stocked inventory items included in the Define Supplies parameter you specified for the report for which the difference between the Maximum Purchase Price and the Minimum Purchase Price of an item on Purchase Order Receipts during the report's Date Range is greater than or equal to 50 percent and less than 100 percent of the Average Purchase Price on Purchase Order Receipts during the report's Date Range.
Calculation: % of Diff. >= 50% and < 100% (Supplies Count) = Sum(Items Where Supply or Part column = Supply and % of Diff. column >= 50% and < 100%)
Example (based on Inventory Purchased Details (Item-level) sub report image): % of Diff. >= 50% and < 100% (Supplies Count) = Sum(0 Items) = 0
Note: To see how the % of Diff. is calculated for each item, see the Dealer Inventory Scorecard Report's Inventory Purchased Details (Transaction-level) sub report.
|
|
|
The ratio of the % of Diff. >= 25% and < 50% (Supplies Count) to the Total Supplies Purchases.
Calculation: % of Diff. >= 50% and < 100% (Supplies Percentage) = (% of Diff. >= 50% and < 100% (Supplies Count) / Total Supplies Purchases) * 100
Example (based on Inventory Purchased Details (Item-level) sub report image): % of Diff. >= 50% and < 100% (Supplies Percentage) = (0 % of Diff. >= 50% and < 100% (Supplies Count) / 321 Total Supplies Purchases) * 100 = 0% |
|
|
The number of stocked inventory items included in the Define Supplies parameter you specified for the report for which the difference between the Maximum Purchase Price and the Minimum Purchase Price of an item on Purchase Order Receipts during the report's Date Range is greater than or equal to 100 percent of the Average Purchase Price on Purchase Order Receipts during the report's Date Range.
Calculation: % of Diff. >= 100% (Supplies Count) = Sum(Items Where Supply or Part column = Supply and % of Diff. column >= 100%)
Example (based on Inventory Purchased Details (Item-level) sub report image): % of Diff. >= 100% (Supplies Count) = Sum(1 Item not shown in the sample image) = 1
Note: To see how the % of Diff. is calculated for each item, see the Dealer Inventory Scorecard Report's Inventory Purchased Details (Transaction-level) sub report.
|
|
|
The ratio of the % of Diff. >= 100% (Supplies Count) to the Total Supplies Purchases.
Calculation: % of Diff. >= 100% (Supplies Percentage) = (% of Diff. >= 100% (Supplies Count) / Total Supplies Purchases) * 100
Example (based on Inventory Purchased Details (Item-level) sub report image): % of Diff. >= 100% (Supplies Percentage) = (1 % of Diff. >= 100% (Supplies Count) / 321 Total Supplies Purchases) * 100 = 0% (rounded to no decimal positions)
Note: To receive a Green Check (
) on Supply Purchases on Page 3 of the main Dealer Inventory Scorecard report, this percentage must be 0%. Although the displayed value rounds to 0% for this sample report, the sample report received a red X () for Supply Purchases because the report included 1 supply item with a % of Diff. >= 100%; the actual percentage, 0.3115%, is greater than 0%. |
|
|
Detail Rows |
|
|
Item number from the Item record. |
|
|
Description of the item from the Item record. |
|
|
Part - The item is included in the Define Parts filter you specified for the report. Supply- The item is included in the Define Supplies filter you specified for the report. Note: The Define Parts and Define Supplies filters you define for the report should not overlap. If they do, an item included in both filters will be listed twice on the sub report — once as a Part and once as a Supply, causing the Inventory Purchased Details to be inflated.
|
|
|
The lowest price at which the item was purchased during the report's Date Range. For details, see the Dealer Inventory Scorecard Report's Inventory Purchased Details (Transaction-level) sub report. |
|
|
The highest price at which the item was purchased during the report's Date Range. For details, see the Dealer Inventory Scorecard Report's Inventory Purchased Details (Transaction-level) sub report. |
|
|
The ratio of the difference between the Maximum Purchase Price and the Minimum Purchase Price of an item on Purchase Order Receipts during the report's Date Range to the Average Purchase Price on Purchase Order Receipts during the report's Date Range.
Calculation: % of Difference Purchase Price = ((Maximum Purchase Price on Receipts during Report's Date Range - Minimum Purchase Price on Receipts during Report's Date Range) / Average Purchase Price on Receipts during Report's Date Range) * 100
Example (based on Inventory Purchased Details (Item-level) sub report image): % of Difference Purchase Price for P001 = (($363.00 Maximum Purchase Price - $363.00 Minimum Purchase Price) / $363.00 Average Purchase Price) * 100 = 0% % of Difference Purchase Price for P002 = (($22.64 Maximum Purchase Price - $22.20 Minimum Purchase Price) / $22.49 Average Purchase Price) * 100 = 2% (rounded to no decimal positions) % of Difference Purchase Price for P003 = (($8.44 Maximum Purchase Price - $8.44 Minimum Purchase Price) / $8.44 Average Purchase Price) * 100 = 0% % of Difference Purchase Price for P004 = (($202.72 Maximum Purchase Price - $202.72 Minimum Purchase Price) / $202.72 Average Purchase Price) * 100 = 0% |
|
|
The average price at which the item was purchased during the report's Date Range.
Calculation: Average Purchase Price = Sum(Total Purchase Cost on Receipts during Report's Date Range)/Sum(Total Quantity on Receipts during Report's Date Range)
Example (based on Inventory Purchased Details (Transaction-level) sub report images): Average Purchase Price for P001 = ($726.00 on Receipt 10001) / 2 Total Quantity = $363.00 Average Purchase Price for P002 = ($22.20 on Receipt 10002 + $22.64 on Receipt 10003 + $22.64 on Receipt 10004) / 3 Total Quantity = $22.49 (rounded to two decimal positions) Average Purchase Price for P003 = ($16.88 on Receipt 10005) / 2 Total Quantity = $8.44 Average Purchase Price for P004 = ($202.72 on Receipt 10006 + $202.72 on Receipt 10007 + $202.72 on Receipt 10008) / 3 Total Quantity = $202.72
Note: To see the images containing the additional detail on which the Average Purchase Price is calculated for each item, see the Dealer Inventory Scorecard Report's Inventory Purchased Details (Transaction-level) sub report.
|
|
|
The sum of the purchase costs for the item during the report's Date Range.
Calculation: Purchase Total Cost = Sum(Total Purchase Cost on Receipts during Report's Date Range)
Example (based on Inventory Purchased Details (Transaction-level) sub report images): Purchase Total Cost for P001 = ($726.00 Total Purchase Cost on Receipt 10001) = $726.00 Purchase Total Cost for P002 = ($22.20 + $22.64 + $22.64 Total Purchase Cost on Receipts 10002, 10003, and 10004, respectively) = $67.48 (rounded to two decimal positions) Purchase Total Cost for P003 = ($16.88 Total Purchase Cost on Receipt 10005) = $16.88 Purchase Total Cost for P004 = ($202.72 + $202.72 + $202.72 Total Purchase Cost on Receipts 10006, 10007, and 10008, respectively) = $608.16
Note: To see the images containing the additional detail on which the Purchase Total Cost is calculated for each item, see the Dealer Inventory Scorecard Report's Inventory Purchased Details (Transaction-level) sub report.
|
|
|
The ratio of the quantity of the item purchased from the preferred vendor on receipts during the report's Date Range to the total quantity of the item purchased on receipts during the report's Date Range.
Calculation: % from Preferred Vendor = (Sum(Quantity Purchased from Preferred Vendor on Receipts during Report's Date Range)/Sum(Quantity Purchased on Receipts during Report's Date Range)) * 100
Example (based on Inventory Purchased Details (Transaction-level) sub report images): % from Preferred Vendor for P001 = ((2 Purchased from Preferred Vendor on Receipt 10001)/(2 Purchased on Receipt 10001)) * 100 = 100% % from Preferred Vendor for P002 = ((3 Purchased from Preferred Vendor on Receipts 10002, 10003, and 10004, respectively)/(3 Purchased on Receipts 10002, 10003, and 10004, respectively)) * 100 = 100% % from Preferred Vendor for P003 = ((0 Purchased from Preferred Vendor on Receipt 10005)/(2 Purchased on Receipt 10005)) * 100 = 0% % from Preferred Vendor for P004 = ((1 Purchased from Preferred Vendor on Receipt 10006)/(3 Purchased on Receipts 10006, 10007, and 10008, respectively)) * 100 = 33%
Note: To see the images containing the additional detail on which the % from Preferred Vendor is calculated for each item, see the Dealer Inventory Scorecard Report's Inventory Purchased Details (Transaction-level) sub report.
|
|
Inventory Purchased Details (Transaction-level) Sub ReportInventory Purchased Details (Transaction-level) Sub Report
Following are samples of the Dealer Inventory Scorecard Report's Inventory Purchased Details (Transaction-level) sub report.
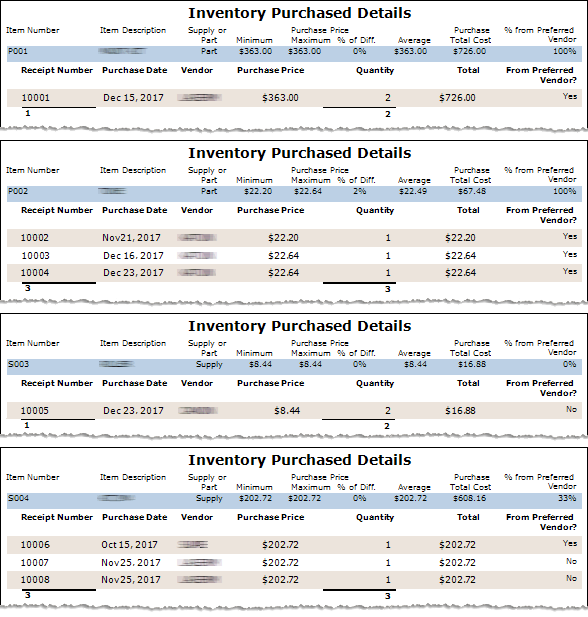
The following table explains how the data in the Inventory Purchased Details (Transaction-level) sub report is used to calculate amounts displayed on the Inventory Purchased Details (Item-level) sub report.
|
Report Label |
Description and/or Calculation |
|
Summary Row |
|
|
Item number from an Item record for which the Inventory Purchased Details (Transaction-level) sub report lists Purchase Order Receipt details from each receipt on which the item was listed during the report's Date Range. |
|
|
Description of the item from the Item record. |
|
|
Part - The item is included in the Define Parts filter you specified for the report. Supply- The item is included in the Define Supplies filter you specified for the report. Note: The Define Parts and Define Supplies filters you define for the report should not overlap. If they do, an item included in both filters will be listed twice on the sub report — once as a Part and once as a Supply, causing the Inventory Purchased Details to be inflated.
|
|
|
The lowest price at which the item was purchased during the report's Date Range.
Calculation: Minimum Purchase Price = Min(Purchase Price on Receipt during report's Date Range)
Example (based on Inventory Purchased Details (Transaction-level) sub report images): Minimum Purchase Price for P001 = $363.00 Minimum Purchase Price on Receipt 10001 Minimum Purchase Price for P002 = $22.20 Minimum Purchase Price on Receipt 10002 Minimum Purchase Price for S003 = $8.44 Minimum Purchase Price on Receipt 10005 Minimum Purchase Price for S004 = $202.72 Minimum Purchase Price on Receipts 10006, 10007, and 10008 |
|
|
The highest price at which the item was purchased during the report's Date Range.
Calculation: Maximum Purchase Price = Max(Purchase Price on Receipt during report's Date Range)
Example (based on Inventory Purchased Details (Transaction-level) sub report images): Maximum Purchase Price for P001 = $363.00 Maximum Purchase Price on Receipt 10001 Maximum Purchase Price for P002 = $22.64 Maximum Purchase Price on Receipts 10003 and 10004 Maximum Purchase Price for S003 = $8.44 Maximum Purchase Price on Receipt 10005 Maximum Purchase Price for S004 = $202.72 Maximum Purchase Price on Receipts 10006, 10007, and 10008 |
|
|
The ratio of the difference between the Maximum Purchase Price and the Minimum Purchase Price of an item on Purchase Order Receipts during the report's Date Range to the Average Purchase Price on Purchase Order Receipts during the report's Date Range.
Calculation: % of Difference Purchase Price = ((Maximum Purchase Price on Receipts during Report's Date Range - Minimum Purchase Price on Receipts during Report's Date Range) / Average Purchase Price on Receipts during Report's Date Range) * 100
Example (based on Inventory Purchased Details (Transaction-level) sub report images): % of Difference Purchase Price for P001 = (($363.00 Maximum Purchase Price on Receipt 10001 - $363.00 Minimum Purchase Price on Receipt 10001) / $363.00 Average Purchase Price) * 100 = 0% % of Difference Purchase Price for P002 = (($22.64 Maximum Purchase Price on Receipts 10003 and 10004 - $22.20 Minimum Purchase Price on Receipt 10002) / $22.49 Average Purchase Price) * 100 = 2% (rounded to no decimal positions) % of Difference Purchase Price for S003 = (($8.44 Maximum Purchase Price on Receipt 10005 - $8.44 Minimum Purchase Price on Receipt 10005) / $8.44 Average Purchase Price) * 100 = 0% % of Difference Purchase Price for S004 = (($202.72 Maximum Purchase Price on Receipts 10006, 10007, and 10008 - $202.72 Minimum Purchase Price on Receipts 10006, 10007, and 10008) / $202.72 Average Purchase Price) * 100 = 0% |
|
|
The average price at which the item was purchased during the report's Date Range.
Calculation: Average Purchase Price = Sum(Purchase Price during Report's Date Range)/Sum(Receipts during Report's Date Range)
Example (based on Inventory Purchased Details (Transaction-level) sub report images): Average Purchase Price for P001 = ($363.00 on Receipt 10001) / 1 Receipt = $363.00 Average Purchase Price for P002 = ($22.20 on Receipt 10002 + $22.64 on Receipt 10003 + $22.64 on Receipt 10004) / 3 Receipts = $22.49 (rounded to two decimal positions) Average Purchase Price for S003 = ($8.44 on Receipt 10005) /1 Receipt = $8.44 Average Purchase Price for S004 = ($202.72 on Receipt 10006 + $202.72 on Receipt 10007 + $202.72 on Receipt 10008) / 3 Receipts = $202.72 |
|
|
The sum of the purchase costs for the item during the report's Date Range.
Calculation: Purchase Total Cost = Sum(Total Purchase Cost on Receipts during Report's Date Range)
Example (based on Inventory Purchased Details (Transaction-level) sub report images): Purchase Total Cost for P001 = ($726.00 Total Purchase Cost on Receipt 10001) = $726.00 Purchase Total Cost for P002 = ($22.20 + $22.64 + $22.64 Total Purchase Cost on Receipts 10002, 10003, and 10004, respectively) = $67.48 (rounded to two decimal positions) Purchase Total Cost for S003 = ($16.88 Total Purchase Cost on Receipt 10005) = $16.88 Purchase Total Cost for S004 = ($202.72 + $202.72 + $202.72 Total Purchase Cost on Receipts 10006, 10007, and 10008, respectively) = $608.16 |
|
|
The ratio of the quantity of the item purchased from the preferred vendor on receipts during the report's Date Range to the total quantity of the item purchased on receipts during the report's Date Range.
Calculation: % from Preferred Vendor = (Sum(Quantity Purchased from Preferred Vendor on Receipts during Report's Date Range)/Sum(Quantity Purchased on Receipts during Report's Date Range)) * 100
Example (based on Inventory Purchased Details (Transaction-level) sub report images): % from Preferred Vendor for P001 = ((2 Purchased from Preferred Vendor on Receipt 10001)/(2 Purchased on Receipt 10001)) * 100 = 100% % from Preferred Vendor for P002 = ((3 Purchased from Preferred Vendor on Receipts 10002, 10003, and 10004, respectively)/(3 Purchased on Receipts 10002, 10003, and 10004, respectively)) * 100 = 100% % from Preferred Vendor for S003 = ((0 Purchased from Preferred Vendor on Receipt 10005)/(2 Purchased on Receipt 10005)) * 100 = 0% % from Preferred Vendor for S004 = ((1 Purchased from Preferred Vendor on Receipt 10006)/(3 Purchased on Receipts 10006, 10007, and 10008, respectively)) * 100 = 33% |
|
|
Detail Rows |
|
|
Number identifying a Purchase Order Receipt in e-automate on which the item was listed during the report's Date Range. |
|
|
Date associated with the Purchase Order Receipt in e-automate. |
|
|
Vendor name associated with the Purchase Order Receipt in e-automate. |
|
|
Price for a quantity of one of this item on this receipt.
Example (based on Inventory Purchased Details (Transaction-level) sub report images): Purchase Price for a Quantity of 1 P001 on Receipt 10001 = $363.00 Purchase Price for a Quantity of 1 P002 on Receipt 10002 = $22.00 Purchase Price for a Quantity of 1 P002 on Receipt 10003 = $22.64 Purchase Price for a Quantity of 1 P002 on Receipt 10004 = $22.64 Purchase Price for a Quantity of 1 S003 on Receipt 10005 = $8.44 Purchase Price for a Quantity of 1 S004 on Receipt 10006 = $202.72 Purchase Price for a Quantity of 1 S004 on Receipt 10007 = $202.72 Purchase Price for a Quantity of 1 S004 on Receipt 10008 = $202.72 |
|
|
Quantity of this item purchased on this receipt.
Example (based on Inventory Purchased Details (Transaction-level) sub report images): Quantity of P001 on Receipt 10001 = 2 Quantity of P002 on Receipt 10002 = 1 Quantity of P002 on Receipt 10003 = 1 Quantity of P002 on Receipt 10004 = 1 Quantity of S003 on Receipt 10005 = 2 Quantity of S004 on Receipt 10006 = 1 Quantity of S004 on Receipt 10007 = 1 Quantity of S004 on Receipt 10008 = 1 |
|
|
The total cost of an item (purchase price multiplied by the quantity) on a receipt during the report's Date Range.
Calculation: Total = Purchase Price * Quantity
Example (based on Inventory Purchased Details (Transaction-level) sub report images): Total for P001 on Receipt 10001 = $363.00 Purchase Price * 2 Quantity = $726.00 Total for P002 on Receipt 10002 = $22.00 Purchase Price * 1 Quantity = $22.00 Total for P002 on Receipt 10003 = $22.64 Purchase Price * 1 Quantity = $22.64 Total for P002 on Receipt 10004 = $22.64 Purchase Price * 1 Quantity = $22.64 Total for S003 on Receipt 10005 = $8.44 Purchase Price * 2 Quantity = $16.88 Total for S004 on Receipt 10006 = $202.72 Purchase Price * 1 Quantity = $202.72 Total for S004 on Receipt 10007 = $202.72 Purchase Price * 1 Quantity = $202.72 Total for S004 on Receipt 10008 = $202.72 Purchase Price * 1 Quantity = $202.72 |
|
|
Yes = The vendor from whom this item was purchased on this receipt is listed as the preferred vendor for this item on the Vendors tab of the Item record.
Example (based on Inventory Purchased Details (Transaction-level) sub report images): P001 on Receipt 10001 = Yes P002 on Receipt 10002 = Yes P002 on Receipt 10003 = Yes P002 on Receipt 10004 = Yes S003 on Receipt 10005 = No S004 on Receipt 10006 = Yes S004 on Receipt 10007 = No S004 on Receipt 10008 = No |
|
|
The total number of receipts during the report's Date Range that have a quantity of the item.
Calculation: Total Receipts = Sum(Receipts Containing Item)
Example (based on Inventory Purchased Details (Transaction-level) sub report images): Total Receipts for P001 = (Receipt 10001) = 1 Total Receipts for P002 = (Receipt 10002 + Receipt 10003 + Receipt 10004) = 3 Total Receipts for S003 = (Receipt 10005) = 1 Total Receipts for S004 = (Receipt 10006 + Receipt 10007 + Receipt 10008) = 3 |
|
|
The total quantity of an item on all receipts during the report's Date Range.
Calculation: Quantity Total = Sum(Quantity on Receipts)
Example (based on Inventory Purchased Details (Transaction-level) sub report images): Total Quantity for P001 = (2 on Receipt 10001) = 2 Total Quantity for P002 = (1 on Receipt 10002 + 1 on Receipt 10003 + 1 on Receipt 10004) = 3 Total Quantity for S003 = (2 on Receipt 10005) = 2 Total Quantity for S004 = (1 on Receipt 10006 + 1 on Receipt 10007 + 1 on Receipt 10008) = 3 |
|
Dead Inventory (Zero Inventory Turn) Details Sub ReportDead Inventory (Zero Inventory Turn) Details Sub Report
Following is a sample Dealer Inventory Scorecard Report's Dead Inventory Details sub report.
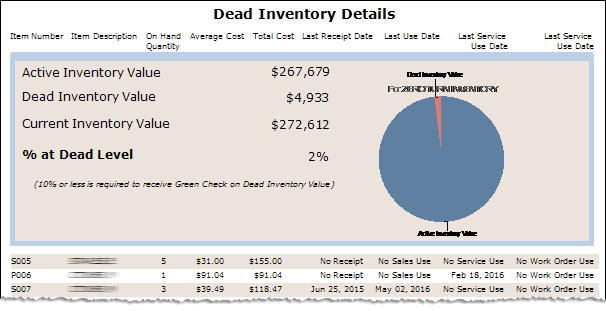
The following table explains how the data in the Dead Inventory Details sub report is used to calculate amounts displayed on the main report.
|
Report Label |
Description and/or Calculation |
|
Summary Table |
|
|
The sum of the average costs of all items included in the report based on your Define Parts and Define Supplies parameters that have an on-hand quantity greater than 0 (zero) and that do not meet your Dead Inventory Use Months and Dead Inventory Receipt Months parameters for what constitutes dead inventory.
Calculation: Active Inventory Value = Sum(Average Cost of All Items Included in Report) - Sum(Average Cost of All Dead Inventory Items Included in Report)
Example (based on Main Report image using Dead Inventory Use Months = 18 months and Dead Inventory Receipt Months = 18 months): Active Inventory Value = $272,611.61 Average Cost of All Items Included in Report - $4,932.96 Average Cost of Dead Inventory Items Included in Report = $267,679 (rounded to nearest integer) Note: To see how the system arrives at the Dead Inventory Value ($4,932.96) to subtract from the Current Inventory Value ($272,611.61) to calculate the Active Inventory Value ($267,678.85), see the Dead Inventory Value and Current Inventory Value sections of this table.
|
|
|
The sum of the average costs of all items included in the report based on your Define Parts and Define Supplies parameters that meets your Dead Inventory Use Months and/or Dead Inventory Receipt Months parameters for what constitutes dead inventory. The Dead Inventory Details sub report lists one row for each item that meets the dead inventory criteria. Items are sequenced by Item Number.
Calculation: Dead Inventory Value = Sum(Average Cost of All Dead Inventory Items Included in Report)
Example (based on Main Report image using Dead Inventory Use Months = 18 months and Dead Inventory Receipt Months = 18 months): Dead Inventory Value = $4,933 (rounded to nearest integer) Note: To get the exact monetary amount of the Dead Inventory Value, export the Dead Inventory (Zero Inventory Turn) Details sub report data to an Excel file and sum the Cost column (Column E).
|
|
|
The total inventory average cost (inventory quantity * average cost) of the items included in the Define Parts and Define Supplies parameters you specified for the report.
Calculation: Current Inventory Value = Sum(Inventory Quantity * Average Cost for Each Item Included in Report)
Example (based on Dead Inventory Details image): Current Inventory Value = $272,612 (rounded to nearest integer) Note: The Dealer Inventory Cost Details sub report lists the details on which this number is based. To get the exact monetary amount of the Current Inventory Value ($272,611.61), export the Dealer Inventory Cost Details sub report data to an Excel file, multiply the Quantity column (Column D) by the Average Cost column (Column F) and store the results in Column J, and then sum Column J.
|
|
|
The ratio of Dead Inventory Value to Current Inventory Value.
Calculation: % at Dead Level = Dead Inventory Value / Current Inventory Value
Example (based on Dead Inventory Details image): % at Dead Level = $4,933 / $272,612 = 2% (0.018095 rounded to two decimal positions) |
|
|
Detail Rows (Dead Inventory Only) |
|
|
Item number from the Item record identifying a specific item that meets your criteria for being dead inventory. |
|
|
Description of the item from the Item record. |
|
|
The on-hand quantity of the item. In e-automate, the On hand quantity is listed in the Summary region on the Inventory Availability window, which is accessible from the Items list window.
Example (based on Dead Inventory Details image): On Hand Quantity of P005 = 5 On Hand Quantity of S006 = 1 On Hand Quantity of S007 = 3 |
|
|
The average cost of the item. In e-automate, the Average cost is listed in the Summary region on the Inventory Availability window, which is accessible from the Items list window.
Example (based on Dead Inventory Details image): Average Cost of 1 P005 = $31.00 Average Cost of 1 S006 = $91.04 Average Cost of 1 S007 = $39.49 |
|
|
The total average cost of the quantity of the item on hand.
Calculation: Total Cost = On Hand Quantity * Average Cost
Example (based on Dead Inventory Details image): Total Cost of P005 = 5 On Hand Quantity * $31.00 Average Cost = $155.00 Total Cost of S006 = 1 On Hand Quantity * $91.04 Average Cost = $91.04 Total Cost of S007 = 3 On Hand Quantity * $39.49 Average Cost = $118.47 |
|
|
The date—if any—on which this dead inventory item was last received into inventory. If the item was last received into inventory more than the number of Dead Inventory Receipt Months prior to the Month/Year of the end date in the Date Range you specified for the report, then the system lists the last receipt date. If the item was not received into inventory prior to the end date of the Date Range, then the system lists "No Receipt".
Calculation: Dead Inventory Receipt Date Cutoff = Date Range End Date Month and Year - Dead Inventory Receipt Months If no receipt exists prior to report End Date, list "No Receipt".
Example (based on Dead Inventory Details image and 18 Dead Inventory Receipt Months): Dead Inventory Receipt Date Cutoff = 12/2017 End Date Month and Year - 18 Dead Inventory Receipt Months = 6/2016 P005 = No Receipt. The item was not received into inventory prior to the 12/31 Report End Date. S006 = No Receipt. The item was not received into inventory prior to the 12/31 Report End Date. S007 = Jun 25, 2015. The last receipt date is prior to 6/2016. |
|
|
The date—if any—on which this dead inventory item was last used on a sales invoice. If the item was last used on a sales invoice more than the number of Dead Inventory Use Months prior to the Month/Year of the end date in the Date Range you specified for the report, then the system lists the last used date. If the item was not used on a sales invoice prior to the end date of the Date Range, then the system lists "No Sales Use".
Calculation: Dead Inventory Use Date Cutoff = Date Range End Date Month and Year - Dead Inventory Use Months If no sales use exists prior to report End Date, list "No Sales Use".
Example (based on Dead Inventory Details image and 18 Dead Inventory Use Months): Dead Inventory Use Date Cutoff = 12/2017 End Date Month and Year - 18 Dead Inventory Use Months = 6/2016 P005 = No Sales Use. The item was not used on a sales invoice prior to the 12/31 Report End Date. S006 = No Sales Use. The item was not used on a sales invoice prior to the 12/31 Report End Date. S007 = May 02, 2016. The last sales use date is prior to 6/2016. |
|
|
The date—if any—on which this dead inventory item was last used on a service invoice. If the item was last used on a service invoice more than the number of Dead Inventory Use Months prior to the Month/Year of the end date in the Date Range you specified for the report, then the system lists the last used date. If the item was not used on a service invoice prior to the end date of the Date Range, then the system lists "No Service Use".
Calculation: Dead Inventory Use Date Cutoff = Date Range End Date Month and Year - Dead Inventory Use Months If no service use exists prior to report End Date, list "No Sales Use".
Example (based on Dead Inventory Details image and 18 Dead Inventory Use Months): Dead Inventory Use Date Cutoff = 12/2017 End Date Month and Year - 18 Dead Inventory Use Months = 6/2016 P005 = No Service Use. The item was not used on a service invoice prior to the 12/31 Report End Date. S006 = No Service Use. The item was not used on a service invoice prior to the 12/31 Report End Date. S007 = May 02, 2016. The last service use date is prior to 6/2016. |
|
|
The date—if any—on which this dead inventory item was last used on a production work order. If the item was last used on a production work order more than the number of Dead Inventory Use Months prior to the Month/Year of the end date in the Date Range you specified for the report, then the system lists the last used date. If the item was not used on a service invoice prior to the end date of the Date Range, then the system lists "No Service Use".
Calculation: Dead Inventory Use Date Cutoff = Date Range End Date Month and Year - Dead Inventory Use Months If no production work order use exists prior to report End Date, list "No Work Order Use".
Example (based on Dead Inventory Details image and 18 Dead Inventory Use Months): Dead Inventory Use Date Cutoff = 12/2017 End Date Month and Year - 18 Dead Inventory Use Months = 6/2016 P005 = No Work Order Use. The item was not used on a production work order prior to the 12/31 Report End Date. S006 = No Work Order Use. The item was not used on a production work order prior to the 12/31 Report End Date. S007 = No Work Order Use. The item was not used on a production work order prior to the 12/31 Report End Date. |
|
Inventory Usage Details Sub ReportInventory Usage Details Sub Report
Following is a sample Dealer Inventory Scorecard Report's Dealer Inventory Usage Details sub report. Note that Item Number P002, which appears on the Dealer Inventory Cost Details and Inventory Purchased Details sub reports does not appear on this report, indicating the item was not used during this period, but also does not appear on the Dead Inventory Details sub report, indicating the item does not yet meet the criteria specified for counting the item as dead inventory.
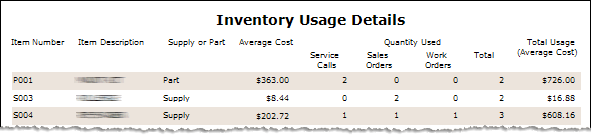
The following table explains how the data in the Inventory Usage Details sub report is used to calculate the amounts displayed on the main report.
|
Report Label |
Description and/or Calculation |
|
Item number from the Item record identifying a specific item that was used on a Sales Order, Service Call, and/or Production Work Order during the report's Date Range. |
|
|
Description of the item from the Item record. |
|
|
Part - The item is included in the Define Parts filter you specified for the report. Supply- The item is included in the Define Supplies filter you specified for the report. Note: The Define Parts and Define Supplies filters you define for the report should not overlap. If they do, an item included in both filters will be listed twice on the sub report — once as a Part and once as a Supply, causing the Inventory Usage Details to be inflated.
Example (based on Inventory Usage Details image): P001 = Part S003 = Supply S004 = Supply |
|
|
The item's average cost as recorded in the Avg. cost column of the Inventory Availability window, which is accessible from the Item record in e-automate.
Example (based on Inventory Usage Details image): Average Cost of 1 P001 = $363.00 Average Cost of 1 S003 = $8.44 Average Cost of 1 S004 = $202.72 |
|
|
The quantity of the item used on a service call during the Date Range you specified for the report.
Example (based on Inventory Usage Details image): Quantity of P001 Used on Service Calls = 2 Quantity of S003 Used on Service Calls = 0 Quantity of S004 Used on Service Calls = 1 |
|
|
The quantity of the item used on a sales order during the Date Range you specified for the report.
Example (based on Inventory Usage Details image): Quantity of P001 Used on Sales Orders = 0 Quantity of S003 Used on Sales Orders = 2 Quantity of S004 Used on Sales Orders = 1 |
|
|
The quantity of the item used on a production work order during the Date Range you specified for the report.
Example (based on Inventory Usage Details image): Quantity of P001 Used on Work Orders = 0 Quantity of S003 Used on Work Orders = 0 Quantity of S004 Used on Work Orders = 1 |
|
|
The total quantity of the item used on all service calls, sales orders, and production work orders within the Date Range you specified for the report.
Calculation: Total (Quantity Used) = Service Calls (Quantity Used) + Sales Orders (Quantity Used) + [Production] Work Orders (Quantity Used)
Example (based on Inventory Usage Details image): P001 Total (Quantity Used) = 2 Service Calls (Quantity Used) + 0 Sales Orders (Quantity Used) + 0 [Production] Work Orders (Quantity Used) = 2 S003 Total (Quantity Used) = 0 Service Calls (Quantity Used) + 2 Sales Orders (Quantity Used) + 0 [Production] Work Orders (Quantity Used) = 2 S004 Total (Quantity Used) = 1 Service Calls (Quantity Used) + 1 Sales Orders (Quantity Used) + 1 [Production] Work Orders (Quantity Used) = 3 |
|
|
The total quantity of the item used on all service calls, sales orders, and production work orders within the Date Range you specified for the report multiplied by the item's Average Cost.
Calculation: Total Usage (Average Cost) = Total (Quantity Used) * Average Cost
Example (based on Inventory Usage Details image): P001 Total Usage (Average Cost) = 2 Total (Quantity Used) * $363.00 = $726.00 S003 Total Usage (Average Cost) = 2 Total (Quantity Used) * $8.44 = $16.88 S004 Total Usage (Average Cost) = 2 Total (Quantity Used) * $202.72 = $608.16 |
Service Call Details Sub ReportService Call Details Sub Report
Following is a sample Dealer Inventory Scorecard Report's Service Call Details sub report. This sub report includes details for each call that was marked complete or incomplete during the Date Range you specified for the report.
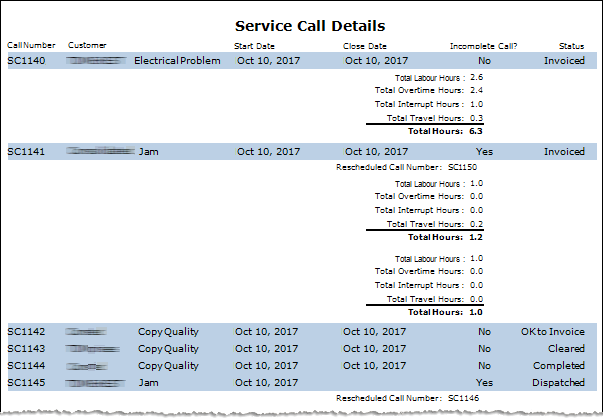
The following table explains how the data in the Service Call Details sub report is used to calculate the amounts displayed in the main report.
|
Report Label |
Description and/or Calculation |
| The Call number on the service call work order, identifying a service call that was marked complete or incomplete within the report's Date Range. Calls are sequenced on the Service Call Details sub report by Call number. | |
| The name of the Customer associated with the service call. | |
| The Call type description associated with the service call. | |
| The Call received at date on the service work order. | |
| The service call's Date closed.
Note: This field is blank if the call is marked incomplete and has not yet been closed.
|
|
|
Yes = The service call was marked incomplete and rescheduled. Note: If a service call is marked incomplete in e-automate but not rescheduled, the service call does not appear on this report until its Status changes. If the call is subsequently changed to closed (e.g., the Status is updated to Completed), the call will appear on the report with an Incomplete Call? value of No. For this reason, if your company leaves incomplete calls open without rescheduling them until such time as the original call can be closed, this report will not provide an accurate picture of your company's rescheduled call percentage.
|
|
|
The Call number of the follow-up service call the system generates when an incomplete call is rescheduled. |
|
|
Cleared = The service call is marked complete and the Ready to review (cleared) box on the Service Invoice window is checked, but the Invoice box in the Service calls table is not checked. Note: The report does not list dispatched calls that are not marked incomplete.
Invoiced = The service call has been invoiced. OK to Invoice = The service call is marked complete and both the Invoice box in the Service calls table and the Ready to review (cleared) box are checked on the Service Invoice window, but the service call has not yet been invoiced. |
|
|
If the Call's Status is Invoiced, the report includes the following additional information for the call: |
|
| The total number of standard labor hours (billable hours worked on a service all during normal business hours) listed per Labor record associated with a service call.
Calculation: Total Labor Hours = Max((DateDiff(ArrivalDateTime, DepartureDateTime) - (Overtime included in DateDiff(ArrivalDateTime, DepartureDateTime) - Interrupt Hours)),(1 - Overtime)) Note: If a user overrides the system-calculated value displayed in the Labor hours field of the Add/Edit Labor window, Total Labor Hours = Labor hours field override value.
Example (based on Service Call Details image with "XX" representing the year portion of the date): SC1140 Total Labor Hours = Max ((DateDiff(10/10/XX 2:25 PM, 10/10/XX 8:25 PM) - (Overtime included in DateDiff(10/10/XX 2:05 PM, 10/10/XX 8:25 PM) - 1 Interrupt Hour)),(1 - Overtime)) = Max((6 Hours - (3.4167 Overtime Hours - 1.0 Interrupt Hours)) ,(1 - 3.4167 Overtime Hours)) = 2.5833 Hours (rounded to four decimal positions) SC1141Total Labor Hours (first labor record) = Max ((DateDiff(10/10/XX 2:30 PM, 10/10/XX 3:30 PM) - (Overtime included in DateDiff(10/10/XX 2:30 PM, 10/10/XX 3:30 PM) - 0 Interrupt Hour)),(1 - 0 Overtime Hours)) = Max((1 Hour - (0.0 Overtime Hours - 0.0 Interrupt Hours)),(1 - 0.0 Overtime Hours)) = 1.0000 Hours (rounded to four decimal positions) SC1141 Total Labor Hours (second labor record) = Max ((DateDiff(10/10/XX 4:00 PM, 10/10/XX 5:00 PM) - (Overtime included in DateDiff(10/10/XX 4:00 PM, 10/10/XX 5:00 PM) - 0 Interrupt Hour)),(1 - 0 Overtime Hours)) = Max((1 Hour - (0.0 Overtime Hours - 0.0 Interrupt Hours)),(1 - 0.0 Overtime Hours)) = 1.0000 Hours (rounded to four decimal positions) Note: For additional examples of standard labor hour calculations, see the Service Statistics topic.
|
|
|
The total number of overtime labor hours (billable hours worked on a service all outside of normal business hours) listed per Labor record associated with a service call.
Calculation: Overtime Hours per Call = Max (((Overtime included in DateDiff(ArrivalDateTime, DepartureDateTime)) - (Interrupt Hours)),(1 - Billable Hours)) Note: If a user overrides the system-calculated value displayed in the Overtime hours field of the Add/Edit Labor window, Overtime Hours per Call = Overtime hours field override value
Example of Overtime Hours per Call (based on Service Call Details image with no override value in the Overtime hours field and with "XX" representing the year portion of the date): SC1140 Overtime Hours = Max (((Overtime included in DateDiff(10/10/XX 2:05 PM, 10/10/XX 8:25 PM)) - (1 Interrupt Hour)),(1 - 2.5833 Billable Hours)) = Max ((3.4167 Overtime Hours - 1 Interrupt Hour),(-1.5833 Billable Hours)) = 2.4167 Hours (rounded to four decimal positions) Note: For additional examples of overtime hour calculations, see the Service Statistics topic.
|
|
|
The total number of work interruption hours listed per Labor record associated with a service call. Note: In the Service Call Details sample image above, for Call Number SC1140, the Labor record's Work interruptions table lists 1 hour of work interruption time. For Call Number SC1141, the rep entered two separate labor records. A work interruption may have occurred between the first and second labor record, but no work interruption time was recorded in either Labor record's Work interruptions table so there is no work interruption time recorded for the service call.
|
|
|
The total time between the Dispatch Date/Time and the Arrival Date/Time per Labor record associated with a service call.
Calculation: Total Travel Hours = Time Difference between Dispatch Date/Time and Arrival Date/Time per Labor Record
Example (based on Service Call Details image with "XX" representing the year portion of the date): SC1140 Travel Hours = Time Difference (10/10/XX 2:05 PM Dispatch Date/Time and 10/10/XX 2:25 PM Dispatch Date/Time) = 0.3333 Hours (rounded to four decimal positions) SC1141 Travel Hours (first labor record) = Time Difference (10/10/XX 2:18 PM Dispatch Date/Time and 10/10/XX 2:30 PM Arrival Date/Time) = 0.2000 Hours (rounded to four decimal positions) SC1141 Travel Hours (second labor record) = Time Difference (10/10/XX 4:00 PM Dispatch Date/Time and 10/10/XX 4:00 PM Arrival Date/Time) = 0.0000 Hours Note: In this instance, both Labor records are for the same service call. In other instances, a service call may have multiple Labor records if a primary rep and one or more assistant reps add a Labor record to the service call.
|
|
| The sum of all the hours listed for the service call.
Calculation: Total Hours = Total Labor Hours + Total Overtime Hours + Total Interrupt Hours + Total Travel Hours
Example (based on Service Call Details image): SC1140 Total Hours = 2.5833 Total Labor Hours + 2.4167 Total Overtime Hours + 1.0000 Total Interrupt Hours + 0.3333 Total Travel Hours = 6.3333 Hours SC1141 Travel Hours (first labor record) = 1.0 Total Labor Hours + 0.0 Total Overtime Hours + 0.0 Total Interrupt Hours + 0.2000 Total Travel Hours = 1.2000 Hours SC1141 Travel Hours (second labor record) = 1.0000 Total Labor Hours + 0.0000 Total Overtime Hours + 0.0000 Total Interrupt Hours + 0.0000 Total Travel Hours = 1.0000 Hours |
|
Non-supported ReleaseNon-supported Release
©2024 ECI and the ECI logo are registered trademarks of ECI Software Solutions, Inc. All rights reserved.