Service Statistics
You can process a Service Statistics report to analyze service activity by rep, branch, and/or company. The report includes activity for calls for which one or more labor records exist.
You can run the report for all dates, a preset date range (e.g., Last Fiscal Quarter), or a custom date range. You can also filter the report by part, technician, response time call type, excluded call type, and/or billable bill code ranges. You can specify average response time, average daily productive hours, gross calls per day, net calls per day, average recall percentage, mean time to repair, average incomplete call percentage, efficiency, average inventory turns (low), average inventory turns (high), average parts cost per call, and average travel time per service call goals. The system will list these goals at the top of the report and highlight in red font any report data that does not meet the goals you specify for the report. You can also choose to use system response hours, use actual hours, remove interrupt hours (valid when used in conjunction with actual hours only), and/or include unavailable hours.
The main report includes the following information:
Report Goals: Average Response Time, Average Daily Productive Hours, Gross Calls per Day, Net Calls per Day, Mean Time To Repair, Average Recall Percentage, Average Incomplete Call Percentage, Efficiency, Average Inventory Turns (Low - High), Average Parts Cost per Call, and Average Travel Time per Service Call
Technician Summary Detail: Tech Number, Tech Name, Days Worked in Period, Total Calls in Period, Gross Calls per Day, Average Response Time, Average Daily Productive Hours, Average Start Time, Average End Time, Net Calls per Day, Average Daily Customer Hours, Mean Time To Repair, Recalls, Average Recall Percentage, Incomplete Calls, Average Incomplete Call Percentage, Efficiency, Inventory Value, Average Inventory Turns, Parts Cost - Wholesale, Average Parts Cost Per Call, Travel Hours in Period, Total Miles Driven in Period, Average Travel Time per Service Call, Average Miles Driven per Call, Average Total Miles per Hour, Customer Hours in Period, Total Customer And Travel Hours, Labor Cost @ Burden Rate, Average Labor Cost per Call, and Parts And Labor Total
Main Branch Averages: Days Worked in Period, Total Calls in Period, Gross Calls per Day, Average Response Time, Average Daily Productive Hours, Average Start Time, Average End Time, Net Calls per Day, Average Daily Customer Hours, Mean Time To Repair, Recalls, Average Recall Percentage, Incomplete Calls, Average Incomplete Call Percentage, Efficiency, Inventory Value, Average Inventory Turns, Parts Cost - Wholesale, Average Parts Cost Per Call, Travel Hours in Period, Total Miles Driven in Period, Average Travel Time per Service Call, Average Miles Driven per Call, Average Total Miles per Hour, Customer Hours in Period, Total Customer And Travel Hours, Labor Cost @ Burden Rate, Average Labor Cost per Call
Report Averages: Days Worked in Period, Total Calls in Period, Gross Calls per Day, Average Response Time, Average Daily Productive Hours, Average Start Time, Average End Time, Net Calls per Day, Average Daily Customer Hours, Mean Time To Repair, Recalls, Average Recall Percentage, Incomplete Calls, Average Incomplete Call Percentage, Efficiency, Inventory Value, Average Inventory Turns, Parts Cost - Wholesale, Average Parts Cost Per Call, Travel Hours in Period, Total Miles Driven in Period, Average Travel Time per Service Call, Average Miles Driven per Call, Average Total Miles per Hour, Customer Hours in Period, Total Customer And Travel Hours, Labor Cost @ Burden Rate, Average Labor Cost per Call
The main report offers drill-down capabilities. The detail sub report includes the following information:
Technician Summary Detail: Tech Name, Days Worked in Period, Total Calls in Period, Gross Calls per Day, Average Response Time, Average Daily Productive Hours, Average Start Time, Average End Time, Net Calls per Day, Average Daily Customer Hours, Mean Time To Repair, Recalls, Average Recall Percentage, Incomplete Calls, Average Incomplete Call Percentage, Efficiency, Inventory Value, Average Inventory Turns, Parts Cost - Wholesale, Average Parts Cost Per Call, Travel Hours in Period, Total Miles Driven in Period, Average Travel Time per Service Call, Average Miles Driven per Call, Average Total Miles per Hour, Customer Hours in Period, Total Customer And Travel Hours, Labor Cost @ Burden Rate, Average Labor Cost per Call, and Parts And Labor Total
Detail per Service Call: Call Number, Call Date, Customer Name, Dispatch Date, Arrival Date, Departure Date, Billable Hours, Overtime, Customer Hours, Response Hours, Travel hours, Productive Hours, Interrupt Hours, Incomplete Calls, Recalls (Count), Mileage, Parts Cost, Total Cost
Summary per Day: Weekday, Month, Day, Year, Total Calls, Billable Hours, Overtime, Customer Hours, Response Hours, Travel hours, Productive Hours, Interrupt Hours, Incomplete Calls, Call Category, Recall (Yes/No), Assist Call (Yes/No), Mileage, Parts Cost, Total Cost
Summary per Technician: Total Calls, Billable Hours, Overtime, Customer Hours, Response Hours*, Travel Hours, Productive Hours, Incomplete Calls, Recalls (Count), Mileage, Parts Cost, Total Cost, and Total Inventory Value
Getting to the ReportGetting to the Report
Log in to e-automate with appropriate permissions.
Click [Reports] to open the Report Console window.
In the left pane, click Service.
In the right pane, double-click Service Statistics to open the Service Statistics window.
Setting Report ParametersSetting Report Parameters
When setting report parameters, each parameter you have selected displays in the upper portion of the right pane. The parameters do not reset. The report displays with the parameters that were set the last time you ran the report. You can use the following parameters:
Date RangeDate Range
To filter service statistics activity by date, do the following:
In the left pane of the Service Statistics window, select Date Range to display the Date Range region in the right pane.
Do ONE of the following:
To include all dates, in the Dates region, use the drop-down menu to select <All Dates>.
To use a pre-defined date range, in the Dates region, use the drop-down menu to select a pre-configured date option (e.g., Last Fiscal Quarter).
To specify a custom date range, do the following:
In the Dates region, use the drop-down menu to select <Custom>.
In the From field, enter the beginning date or use the drop-down calendar to select a date.
In the To field, enter the ending date or use the drop-down calendar to select a date.
PartsParts
To filter by part, do the following:
In the left pane of the Service Statistics window, select Parts to display the Parts region in the right pane.
Do ONE of the following:
To include all parts, in the Parts region, check the Include all Parts checkbox.
To select a range of parts, do the following:
Uncheck the Include all Parts checkbox.
In the From field, enter the beginning part number or use the lookup icon to select a part.
In the To field, enter the ending part number or use the lookup to select a part.
To select parts using the advanced filter, do the following:
Uncheck the Include all Parts checkbox.
Check the Use advanced filter box.
Click the [Advanced filter] button to open the Part Filter window.
Use the QuickSearch functionality to filter for the part(s) you want to include in the report. For information on using QuickSearch functionality, see the Using the QuickSearch topic.
When the Part Filter window displays the part(s) you want to include in the report, click [OK] to return to the Service Statistics window.
Technician FilterTechnician Filter
To filter by technician, do the following:
In the left pane of the Service Statistics window, select Technician Filter to display the Technician Filter region in the right pane.
Do ONE of the following:
To include all technicians, in the Technician Filter region, check the Include all Technician Filter checkbox.
To select a range of models, do the following:
Uncheck the Include all Technician Filter checkbox.
In the From field, enter the beginning technician or use the lookup icon to select a technician.
In the To field, enter the ending technician or use the lookup to select a technician.
To select technicians using the advanced filter, do the following:
Uncheck the Include all Technician Filter checkbox.
Check the Use advanced filter box.
Click the [Advanced filter] button to open the Technician Filter window.
Use the QuickSearch functionality to filter for the technician(s) you want to include in the report. For information on using QuickSearch functionality, see the Using the QuickSearch topic.
When the Technician Filter window displays the technician(s) you want to include in the report, click [OK] to return to the Service Statistics window.
Response Time Call TypesResponse Time Call Types
Use this parameter to specify the call type(s) on which you want to base response time calculations. When you process the report, the system will calculate the Avg Response Time values listed in the main report's Technician Summary Detail, Main Branch Averages, and Report Averages sections using only calls associated with the call type(s) you include in the report using this filter. If you view the detail sub report for a specified technician, you will see an asterisk (*) to the right of each value in the Response Hours column that is associated with a call type you included in the report. In the summary totals listed for each day and for each technician, you will see two totals in the Response Hours column. The top total shows the response time for all calls included in the report regardless of call type. The bottom total shows the response time for calls associated with the call type(s) you include in the report using this filter.
To specify the call types on which to base response time calculations, do the following:
In the left pane of the Service Statistics window, select Call Types to display the Call Types region in the right pane.
Do ONE of the following:
To include all response time call types, in the Call Types region, check the Include all Response Time Call Types checkbox.
To select a range of response time call types, do the following:
Uncheck the Include all Response Time Call Types checkbox.
In the From field, enter the beginning response time call type or use the lookup icon to select a response time call type.
In the To field, enter the ending response time call type or use the lookup icon to select a response time call type.
To select response time call types using the advanced filter, do the following:
Uncheck the Include all Response Time Call Types checkbox.
Check the Use advanced filter box.
Click the [Advanced filter] button to open the Response Time Call Types window.
Use the QuickSearch functionality to filter for the response time call type(s) you want to include in the report. For information on using QuickSearch functionality, see the Using the QuickSearch topic.
When the Response Time Call Types window displays the response time call type(s) you want to include in the report, click [OK] to return to the Service Statistics window.
Excluded Call TypesExcluded Call Types
Use this filter to exclude calls from the report based on call type.
To exclude calls from the report based on call type, do the following:
In the left pane of the Service Statistics window, select Call Types to display the Call Types region in the right pane.
Do ONE of the following:
To include all excluded call types, in the Call Types region, check the Include all Excluded Call Types checkbox.
To select a range of excluded call types, do the following:
Uncheck the Include all Excluded Call Types checkbox.
In the From field, enter the beginning excluded call type or use the lookup icon to select a excluded call type.
In the To field, enter the ending excluded call type or use the lookup icon to select a excluded call type.
To select excluded call types using the advanced filter, do the following:
Uncheck the Include all Excluded Call Types checkbox.
Check the Use advanced filter box.
Click the [Advanced filter] button to open the Excluded Call Types window.
Use the QuickSearch functionality to filter for the excluded call type(s) you want to include in the report. For information on using QuickSearch functionality, see the Using the QuickSearch topic.
When the Excluded Call Types window displays the excluded call type(s) you want to include in the report, click [OK] to return to the Service Statistics window.
Billable Bill CodesBillable Bill Codes
To filter by billable bill code, do the following:
In the left pane of the Service Statistics window, select Billable Bill Codes to display the Billable Bill Codes region in the right pane.
Do ONE of the following:
To include all billable bill codes, in the Billable Bill Codes region, check the Include all Billable Bill Codes checkbox.
To select a range of billable bill codes, do the following:
Uncheck the Include all Billable Bill Codes checkbox.
In the From field, enter the beginning billable bill code number or use the lookup icon to select a billable bill code.
In the To field, enter the ending billable bill code number or use the lookup icon to select a billable bill code.
To select billable bill codes using the advanced filter, do the following:
Uncheck the Include all Billable Bill Codes checkbox.
Check the Use advanced filter box.
Click the [Advanced filter] button to open the Billable Bill Code Filter window.
Use the QuickSearch functionality to filter for the billable bill code(s) you want to include in the report. For information on using QuickSearch functionality, see the Using the QuickSearch topic.
When the Billable Bill Code Filter window displays the billable bill code(s) you want to include in the report, click [OK] to return to the Service Statistics window.
Average Response Time (Goal)Average Response Time (Goal)
The average number of hours within which a technician should arrive at a call after the call is received or—if the call is assigned an on-hold code for which the Calculate response time using release date and time box is checked—after the call is released from hold in order to meet this goal.
Average Daily Productive Hours (Goal)Average Daily Productive Hours (Goal)
The average number of productive hours a technician must put in each day worked to meet this goal.
Gross Calls Per Day (Goal)Gross Calls Per Day (Goal)
The minimum number of calls a technician should average per day worked to meet this goal.
Net Calls Per Day (Goal)Net Calls Per Day (Goal)
The minimum number of calls (excluding recall and incomplete calls) a technician should average per day worked to meet this goal.
Average Recall Percentage (Goal)Average Recall Percentage (Goal)
The maximum ratio of call backs (recalls) to total calls a technician must not exceed to meet this goal.
Mean Time to Repair (Goal)Mean Time to Repair (Goal)
The average number of hours within which a technician should arrive at a call, resolve the call, and depart from the call in order to meet this goal.
Average Incomplete Call Percentage (Goal)Average Incomplete Call Percentage (Goal)
The maximum ratio of incomplete calls to total calls a technician must not exceed to meet this goal.
Efficiency (Goal)Efficiency (Goal)
The minimum efficiency rating a technician must achieve to meet this goal. The system calculates a technician's efficiency rating as follows: 1 - (Number of Recalls/Number of Calls) - (Number of Incomplete Calls/Number of Calls).
Average Inventory Turn (Low) (Goal)Average Inventory Turn (Low) (Goal)
The minimum number of times per year a technician's inventory should be sold (used on service calls) and replaced (restocked) to meet this goal.
Average Inventory Turn (High) (Goal)Average Inventory Turn (High) (Goal)
The maximum number of times per year a technician's inventory should be sold (used on service calls) and replaced (restocked) to meet this goal.
Average Parts Cost Per Call (Goal)Average Parts Cost Per Call (Goal)
The average wholesale cost of parts used per service call a technician should not exceed to meet this goal.
Average Travel Time Per Service Call (Goal)Average Travel Time Per Service Call (Goal)
The average number of travel hours per service call a technician should not exceed to meet this goal.
Report OptionsReport Options
The Report Options selections determine how the system calculates response time and productive hours. Check or uncheck the following boxes as appropriate:
Use System Response Hours: When checked (or when Use Actual Hours is unchecked), the system calculates response time from the time a call is received (or, in the case of an on-hold call that must be removed from hold before service can be performed, from the time the call is removed from hold) to the time the labor record(s) indicate the technician arrived at the call. Additionally, if a user overrides the system-calculated values in the Labor hours and/or Overtime hours fields on the Add/Edit Labor window, the system uses the override values instead of the actual values when calculating Productive Hours.
Use Actual Hours: When checked, the system calculates response time from the time a call is received (or, in the case of an on-hold call that must be removed from hold before service can be performed, from the time the call is removed from hold) to the time the labor record(s) indicate the technician arrived at the call—excluding time outside of normal business hours. Additionally, if a user overrides the system-calculated values in the Labor hours and/or Overtime hours fields on the Add/Edit Labor window, the system uses the actual values instead of the override values when calculating Productive Hours.
Remove Interrupt Hours (Valid w/Actual Hours Only): When this box is checked and the Use Actual Hours box is checked, the system excludes from the Productive Hours column the time for any work interruptions entered on the Add/Edit Labor window. When unchecked and/or when the Use Actual Hours box is unchecked, the system does not exclude from the Productive Hours column the time for any work interruptions entered on the Add/Edit Labor window.
Include Unavailable Hours: When checked, the system counts as hours worked any unavailable hours listed for a technician within the reporting period. On the detail report, the system lists a separate line for each Unavailable time record displayed on the Service hours tab of the Edit Employee window. For each of these lines, the system lists the Activity - Description, Date, and—in Italic font in the Productive Hours column—the number of hours of unavailable time. The system does not includes these hours in the total number of hours displayed in the Productive Hours column, but it does includes these hours as productive hours when calculating the Average Daily Productive Hours. For an example calculation, see the "Understanding Report Calculations" section of this topic. When unchecked, the system does not list unavailable hours on the report and does not include these hours as productive hours when calculating the Average Daily Productive Hours.
Processing the ReportProcessing the Report
On the Service Statistics window, click [OK] to process the report.
Viewing the Sub ReportViewing the Sub Report
Using the main report's drill-down capability, you can view a detail sub report.
The detail sub report includes the following information:
Detail per Technician: Tech Name, Days Worked in Period, Total Calls in Period, Gross Calls per Day, Average Response Time, Average Daily Productive Hours, Average Start Time, Average End Time, Net Calls per Day, Average Daily Customer Hours, Mean Time To Repair, Recalls, Average Recall Percentage, Incomplete Calls, Average Incomplete Call Percentage, Efficiency, Inventory Value, Average Inventory Turns, Parts Cost - Wholesale, Average Parts Cost Per Call, Travel Hours in Period, Total Miles Driven in Period, Average Travel Time per Service Call, Average Miles Driven per Call, Average Total Miles per Hour, Customer Hours in Period, Total Customer And Travel Hours, Labor Cost @ Burden Rate, Average Labor Cost per Call, and Parts And Labor Total
Detail per Service Call: Call Number, Call Date, Customer Name, Dispatch Date, Arrival Date, Departure Date, Billable Hours, Overtime, Customer Hours, Response Hours, Travel hours, Productive Hours, Interrupt Hours, Incomplete Calls, Recalls (Count), Mileage, Parts Cost, Total Cost
Summary per Day: Weekday, Month, Day, Year, Total Calls, Billable Hours, Overtime, Customer Hours, Response Hours, Travel hours, Productive Hours, Interrupt Hours, Incomplete Calls, Call Category, Recall (Yes/No), Assist Call (Yes/No), Mileage, Parts Cost, Total Cost
Summary per Technician: Total Calls, Billable Hours, Overtime, Customer Hours, Response Hours*, Travel Hours, Productive Hours, Incomplete Calls, Recalls (Count), Mileage, Parts Cost, Total Cost, and Total Inventory Value
To view the detail sub report, do the following:
In the main report, locate the technician for whom you want to view the detail sub report.
Double-click anywhere in the technician's summary detail region of the main report to access the detail sub report.
Understanding Report CalculationsUnderstanding Report Calculations
Main ReportMain Report
Following is an excerpt of the main Service Statistics report. For calculation illustration purposes, this report was processed with a Response Time Call Types range of CQ to CQ, and with the Use Actual Hours, Remove Interrupt Hours (Valid w/Actual Hours Only), and Include Unavailable Hours boxes checked under Report Options.
The table below this image provides information relating to report goals only. To see the calculations for the detail below the report goals, see the "Detail Sub Report" section of this topic.
Service Statistics - Main Report Image
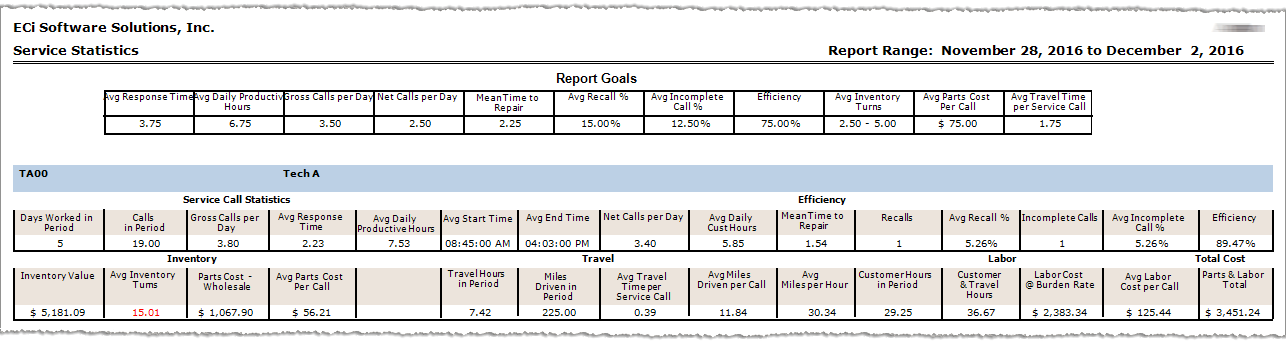
The following table provides information relating to the Report Goals section at the top of the main report and how the system applies those goals to the Technician Summary Detail sections. When the report is processed to include data for multiple technicians, the main report also lists Main Branch Averages and Report Averages sections (not shown in the sample image above). When these two additional sections are present, the system applies the Report Goals to these sections in the same manner that it applies them to the Technician Summary Detail sections. To see the calculations on which the Technicians Summary Details sections are based, see the "Detail Sub Report" section of this topic.
|
Report Label |
Calculations |
|
The maximum average number of hours it should take from the time a call is received—or, if the call is assigned an on-hold code for which the Calculate response time using release date and time box is checked, from the time the call is released from hold—to the time a technician completes the call to meet this goal. The system displays in this field on the report the value entered in the Average Response Time (Goal) field (rounded to two decimal positions) on the Service Statistics window at the time the report was processed.
Calculation: If Technician's Avg Response Time <= Report Goal Avg Response Time, then system displays value in black font. If Technician's Avg Response Time > Report Goal Avg Response Time, then system displays value in red font.
Example (based on Main Report image): Tech A's Avg Response Time of 2.23 hours is less than Report Goal Avg Response Time of 3.75 hours, so system displays Tech A's Avg Response Time value in black font. For details on how the system calculated the 2.23 average response time hours for Tech A, see the Detail Sub Report section of this topic. |
|
|
The minimum average number of productive hours a technician must put in each day worked to meet this goal. The system displays in this field on the report the value entered in the Average Daily Productive Hours (Goal) field (rounded to two decimal positions) on the Service Statistics window at the time the report was processed.
Calculation: If Technician's Avg Daily Productive Hours >= Report Goal Avg Daily Productive Hours, then system displays value in black font. If Technician's Avg Daily Productive Hours < Report Goal Avg Daily Productive Hours, then system displays value in red font.
Example (based on Main Report image): Tech A's Avg Daily Productive Hours of 7.53 hours is greater than Report Goal Avg Daily Productive Hours of 6.75 hours, so system displays Tech A's Avg Daily Productive Hours value in black font. For details on how the system calculated the 7.53 average daily productive time hours for Tech A, see the Detail Sub Report section of this topic. |
|
|
The minimum average number of gross calls per day a technician must work to meet this goal. The system displays in this field on the report the value entered in the Gross Calls per Day (Goal) field (rounded to two decimal positions) on the Service Statistics window at the time the report was processed. Note: Gross calls include regular, call back (recalls), and incomplete calls.
Calculation: If Technician's Gross Calls per Day >= Report Goal Gross Calls per Day, then system displays value in black font. If Technician's Gross Calls per Day < Report Goal Gross Calls per Day, then system displays value in red font.
Example (based on Main Report image): Tech A's Gross Calls per Day of 3.80 is greater than Report Goal Gross Calls per Day of 3.50, so system displays Tech A's Gross Calls per Day value in black font. For details on how the system calculated the 3.80 average gross calls per day for Tech A, see the Detail Sub Report section of this topic. |
|
|
The minimum average number of net calls per day a technician must work to meet this goal. The system displays in this field on the report the value entered in the Net Calls per Day (Goal) field (rounded to two decimal positions) on the Service Statistics window at the time the report was processed. Note: Net calls include regular calls, but do not include call back (recalls) and incomplete calls.
Calculation: If Technician's Net Calls per Day >= Report Goal Net Calls per Day, then system displays value in black font. If Technician's Net Calls per Day < Report Goal Net Calls per Day, then system displays value in red font.
Example (based on Main Report image): Tech A's Net Calls per Day of 3.40 is greater than Report Goal Net Calls per Day of 2.50, so system displays Tech A's Net Calls per Day value in black font. For details on how the system calculated the 3.40 average net calls per day for Tech A, see the Detail Sub Report section of this topic. |
|
|
The maximum average amount of time it should take a technician to complete a repair for a call to meet this goal. The system displays in this field on the report the value entered in the Mean Time to Repair (Goal) field (rounded to two decimal positions) on the Service Statistics window at the time the report was processed.
Calculation: If Technician's Mean Time to Repair <= Report Goal Mean Time to Repair, then system displays value in black font. If Technician's Mean Time to Repair > Report Goal Mean Time to Repair, then system displays value in red font.
Example (based on Main Report image): Tech A's Mean Time to Repair of 1.54 is less than Report Goal Mean Time to Repair of 2.25, so system displays Tech A's Mean Time to Repair value in black font. For details on how the system calculated the 1.54 mean time to repair hours per call for Tech A, see the Detail Sub Report section of this topic. |
|
|
The maximum percentage of a technician's worked calls in the reporting period that may result in call back (recall) calls to meet this goal. The system displays in this field on the report the value entered in the Average Recall Percentage (Goal) field (rounded to two decimal positions) on the Service Statistics window at the time the report was processed. Note: The system considers a call a call back when a subsequent call meets your system's call back parameters and for which the Override call back box was not checked for the call on the New/Edit Service Work Order window.
Calculation: If Technician's Avg Recall % <= Report Goal Avg Recall %, then system displays value in black font. If Technician's Avg Recall % > Report Goal Avg Recall %, then system displays value in red font.
Example (based on Main Report image): Tech A's Avg Recall % of 5.26 is less than Report Goal Avg Recall % of 15.00, so system displays Tech A's Avg Recall % value in black font. For details on how the system calculated the 5.26 average recall percentage for Tech A, see the Detail Sub Report section of this topic. |
|
|
The maximum percentage of a technician's worked calls in the reporting period that may result in incomplete calls to meet this goal. The system displays in this field on the report the value entered in the Average Incomplete Call Percentage (Goal) field (rounded to two decimal positions) on the Service Statistics window at the time the report was processed.
Calculation: If Technician's Avg Incomplete Call % <= Report Goal Avg Incomplete Call %, then system displays value in black font. If Technician's Avg Incomplete Call % > Report Goal Avg Incomplete Call %, then system displays value in red font.
Example (based on Main Report image): Tech A's Avg Incomplete Call % of 5.26 is less than Report Goal Avg Incomplete Call % of 12.50, so system displays Tech A's Avg Incomplete Call % value in black font. For details on how the system calculated the 5.26 average incomplete percentage for Tech A, see the Detail Sub Report section of this topic. |
|
|
The minimum efficiency percentage a technician may have to meet this goal. The system displays in this field on the report the value entered in the Efficiency (Goal) field (rounded to two decimal positions) on the Service Statistics window at the time the report was processed. Note: The system calculates a technician's efficiency percentage by subtracting from 100% the technician's percentage of recalls and incomplete calls.
If Technician's Efficiency >= Report Goal Efficiency, then system displays value in black font. If Technician's Efficiency < Report Goal Efficiency, then system displays value in red font.
Example (based on Main Report image): Tech A's Efficiency of 89.47% is less than Report Goal Efficiency of 75.00%, so system displays Tech A's Efficiency value in black font. For details on how the system calculated the 89.47 efficiency percentage for Tech A, see the Detail Sub Report section of this topic. |
|
|
The minimum and maximum average number of inventory turnovers per year a technician may have to meet this goal. The system displays in this field on the report the values entered in both the Average Inventory Turns (Low) (Goal) and the Average Inventory Turns (High) (Goal) fields (rounded to two decimal positions) on the Service Statistics window at the time the report was processed.
If Technician's Avg Inventory Turns >= Report Goal Avg Inventory Turns (Low) and <= Report Goal Avg Inventory Turns (High), then system displays value in black font. If Technician's Avg Inventory Turns < Report Goal Avg Inventory Turns (Low) or > Report Goal Avg Inventory Turns (High), then system displays value in red font.
Example (based on Main Report image): Tech A's Avg Inventory Turns of 15.01 is higher than Report Goal Avg Inventory Turns (High) of 5.00%, so system displays Tech A's Avg Inventory Turns value in red font. For details on how the system calculated the 15.01 average inventory turns per year for Tech A, see the Detail Sub Report section of this topic. |
|
|
The maximum average wholesale cost of parts a technician may use to complete a call to meet this goal. The system displays in this field on the report the value entered in the Average Parts Cost per Call (Goal) field (rounded to two decimal positions) on the Service Statistics window at the time the report was processed.
Calculation: If Technician's Avg Parts Cost per Call <= Report Goal Avg Parts Cost per Call, then system displays value in black font. If Technician's Avg Parts Cost per Call > Report Goal Avg Parts Cost per Call, then system displays value in red font.
Example (based on Main Report image): Tech A's Avg Parts Cost per Call of $56.21 is less than Report Goal Avg Parts Cost per Call of $75.00, so system displays Tech A's Avg Parts Cost per Call value in black font. For details on how the system calculated the $56.21 average parts cost per call for Tech A, see the Detail Sub Report section of this topic. |
|
|
The maximum average travel time per service call a technician may have to meet this goal. The system displays in this field on the report the value entered in the Average Travel Time Per Service Call (Goal) field (rounded to two decimal positions) on the Service Statistics window at the time the report was processed.
Calculation: If Technician's Avg Travel Time per Service Call <= Report Goal Avg Travel Time per Service Call, then system displays value in black font. If Technician's Avg Travel Time per Service Call > Report Goal Avg Travel Time per Service Call, then system displays value in red font.
Example (based on Main Report image): Tech A's Avg Travel Time Per Service Call of 0.39 hours is less than Report Goal Avg Travel Time per Service Call of 1.75 hours, so system displays Tech A's Avg Travel Time per Service Call value in black font. For details on how the system calculated the 0.39 average travel time per service call for Tech A, see the Detail Sub Report section of this topic. |
Detail Sub ReportDetail Sub Report
Following is an excerpt of the Service Statistics detail sub report for a technician. For calculation illustration purposes, this report was processed with a Response Time Call Types range of CQ to CQ, and with the Use Actual Hours, Remove Interrupt Hours (Valid w/Actual Hours Only), and Include Unavailable Hours boxes checked under Report Options. For each of the summary values listed at the top of the report image, the table below the image identifies the source of the numbers and/or the calculations for arriving at the numbers.
Service Statistics - Detail Report Image
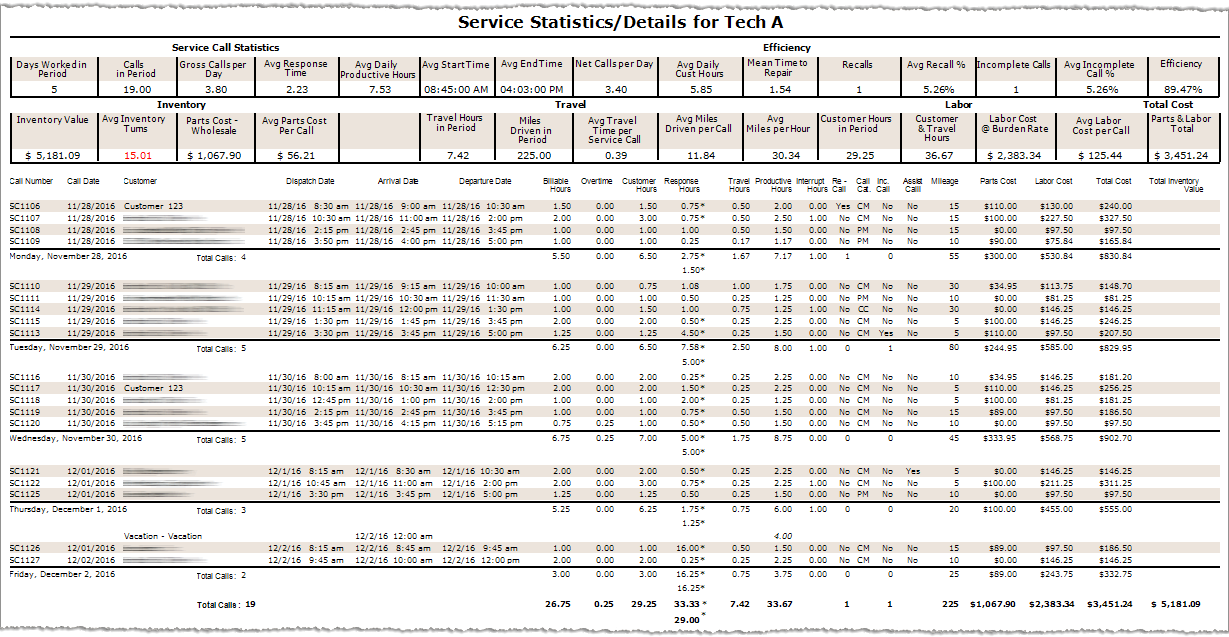
The following table identifies the source of each of the numbers and/or the calculations for arriving at the numbers in the main Service Statistics report's Technician Summary Detail sections, which are also displayed at the top of the detail sub report. Similar calculations are used for computing the averages displayed in the main report's Main Branch Averages and Report Averages sections (not shown in the sample image).
|
Report Label |
Calculations |
|
The total number of days in the reporting period for which a labor record existed for the selected technician.
Example (based on Detail Report image): Days Worked in Period = Monday, 11/28 through Friday, 12/2 = 5 |
|
|
The total number of calls in the reporting period for which a labor record existed for the selected technician. This number includes both call on which the technician was the primary technician and calls on which the selected technician was an assisting technician.
Example (based on Detail Report image): Calls in Period = 4 Calls on 11/28 + 5 Calls on 11/29 + 5 Calls on 11/30 + 3 Calls on 12/1 + 2 Calls on 12/2 = 19 |
|
|
The average number of gross calls per day in the reporting period for the selected technician. Note: Gross calls include recalls and incomplete calls.
Calculation: Gross Calls per Day = Total Calls in Period / Days Worked in Period
Example (based on Detail Report image): Gross Calls per Day = 19 Total Calls in Period / 5 Days Worked in Period = 3.80 |
|
|
The average number of hours from the time a call was received—or, if the call was assigned an on-hold code for which the Calculate response time using release date and time box is checked, from the time the call was released from hold—to the time the selected technician arrived at the call. Note: The Response Time Call Types parameter determines the calls on which the report calculates Avg Response Time. An asterisk (*) appears to the right of each value in the Response Hours column that the system uses for calculating Avg Response Time.
Calculation: Avg Response Time = Response Hours / Total Calls in Period Meeting Response Time Call Types Parameter Examples: Avg Response Time (based on Detail Report image) = 29.00 Response Hours / 13 Total Calls in Period that Met Response Time Call Types parameter = 2.23 Hours (rounded to 2 decimal positions) Note: If the report had been processed for all call types, the calculation would have been: Avg Response Time = 33.33 Response Hours / 19 Total Calls in Period = 1.75 Hours (rounded to 2 decimal positions)
|
|
|
The average number of hours per day worked in the reporting period during which the technician was productive. The Report Options influence how Productive Hours are calculated. If the report is processed with both the Use Actual Hours box and the Remove Interrupt Hours (Valid w/ Actual Hours Only) box unchecked, the system includes Interrupt Hours as Productive Hours. If the report is processed with both the Use Actual Hours box and the Remove Interrupt Hours (Valid w/ Actual Hours Only) box checked, the system excludes Interrupt Hours from the Productive Hours. If the report is processed with the Include Unavailable Hours box checked, the system adds the Unavailable Hours to the Productive Hours when determining the Avg Daily Productive Hours.
Calculation: Avg Daily Productive Hours (Use System Hours Only) = Productive Hours (Includes Interrupt Hours) / Total Calls in Period
Example (based on Detail Report image): Avg Daily Productive Hours (Use System Hours Only) = 34.42 Productive Hours (Includes 3 Interrupt Hours) / 5 Days Worked in Period = 6.88 (Rounded to 2 decimal positions) |
|
|
The average of the Arrival times listed in the first labor record for each day worked in the reporting period for the selected technician.
Calculation: Avg Start Time = First Arrival Time on Each Day Worked / Days Worked in Period Example (based on Detail Report image): Avg Start Time = (09:00:00 AM on 11/28 + 09:15:00 AM on 11/29 + 08:15:00 AM on 11/30 + 08:30:00 AM on 12/1 + 08:45:00 AM on 12/2) / 5 Days Worked in Period = 08:45:00 AM |
|
|
The average of the Departure times listed in the last labor record for each day worked in the reporting period for the selected technician.
Calculation: Avg Start Time = Last Departure Time on Each Day Worked / Days Worked in Period Example (based on Detail Report image): Avg Start Time = (05:00:00 PM on 11/28 + 05:00:00 PM on 11/29 + 05:15:00 PM on 11/30 + 05:00:00 PM on 12/1 + 12:00:00 PM on 12/2) / 5 Days Worked in Period = 04:03:00 PM |
|
|
The average number of net calls per day in the reporting period for the selected technician. Note: Net calls exclude recalls and incomplete calls.
Calculation: Net Calls per Day = (Total Calls in Period - Recalls - Incomplete Calls) / Days Worked in Period
Example (based on Detail Report image): Gross Calls per Day = (19 Total Calls in Period - 1 Recall - 1 Incomplete Call / 5 Days Worked in Period = 3.40 |
|
|
|
The average number of customer hours per day worked in the reporting period for the selected technician.
Calculation: Avg Daily Cust Hours = Total Customer Hours / Days Worked in Period
Example (based on Detail Report image): Avg Daily Cust Hours = 29.25 Total Customer Hours / 5 Days Worked in Period = 5.85 (Rounded to 2 decimal positions) |
|
The average amount of time it took the selected technician to complete a call in the reporting period.
Calculation: Mean Time to Repair = Total Customer Hours / Total Calls in Period
Example (based on Detail Report image): Mean Time to Repair = 29.25 Total Customer Hours / 19 Calls Worked in Period = 1.54 (Rounded to 2 decimal positions) |
|
|
The number of calls in the reporting period for the selected technician for which a subsequent call met your system's call back parameters and for which the Override call back box was not checked for the call on the New/Edit Service Work Order window.
Example (based on Detail Report image): On Monday, 11/28, Tech A worked Call SC1106 for Customer 123. On Wednesday, 11/30, Tech A worked Call SC1117 for the same customer. The Options window (Tools > Options > Service calls > Dispatch console) has a Call back number of days value of 15. Because SC1117 occurred 2 days after SC1106 (within the 15 day window for identifying a call as a call back) and because the Override call back box was not checked for SC1117, the system listed Yes in the Re- Call column for SC1106 (the call for which the call back occurred). |
|
|
The average number of calls in the reporting period for the selected technician for which a call back occurred.
Avg Recall % = Number of Recalls / Total Calls in Period
Example (based on Detail Report image): Avg Recall % = 1 Recall / 19 Calls in Period = 5.26% (Rounded to 2 decimal positions) |
|
|
The number of calls in the reporting period that the selected technician marked as incomplete.
Example (based on Detail Report image): On Tuesday, 11/29, Tech A worked Call SC1113. At the end of the work day, Tech A marked the call incomplete, rescheduled a follow-up call for the next day (SC1116), and then completed the rescheduled call. The system listed Yes in the Inc. Calls column for SC1113 (the call the technician marked as incomplete). |
|
|
The average number of calls in the reporting period for the selected technician that the technician marked as incomplete.
Incomplete Calls % = Number of Recalls / Total Calls in Period
Example (based on Detail Report image): Incomplete Calls % = 1 Recall / 19 Calls in Period = 5.26% (Rounded to 2 decimal positions) |
|
|
One hundred percent minus the technician's percentage of recalls and percentage of incomplete calls.
Efficiency = 1 - (Number of Recalls / Total Calls in Period) - (Number of Incomplete Calls / Total Calls in Period)
Example (based on Detail Report image): Efficiency = 1 - (1 Recall / 19 Calls) - (1 Incomplete Call / 19 Calls in Period) = 89.47% (Rounded to 2 decimal positions) |
|
|
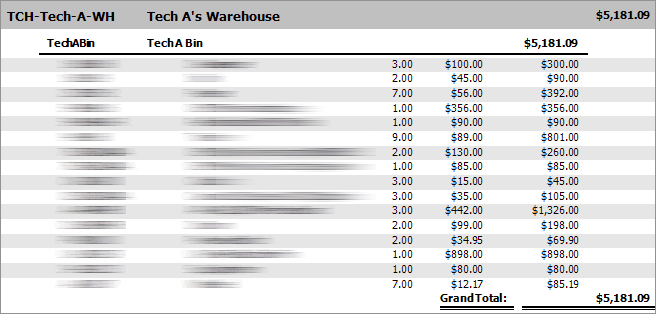
The total cost of all items in the selected technician's inventory. Note: To see the numbers on which this total is based, go to Inventory > Warehouses to open the Inventory Warehouses window, right click the appropriate warehouse in the display, and then select Reports > Inventory Valuation by Warehouse from the right-click menu.
|
|
|
The average number of times per year a technician's inventory is sold (used on service calls) and replaced (restocked). Tip: The minimum recommended reporting period is one month. If you process a report for a period shorter than one month, the system may not have sufficient data on which to base a meaningful average number of inventory turns per year.
Calculation: If the reporting period is greater than or equal to one month: Avg Inventory Turns = ((Sum of Parts Cost Wholesale) * (12 Months / Reporting Period Months)) / Inventory Value If the reporting period is less than one month: Avg Inventory Turns = ((Sum of Parts Cost Wholesale) * (12 Months / (Days in Reporting Period/30.3333 Days))) / Inventory Value
Examples: Based on one-month reporting period (not shown in sample image): Avg Inventory Turns = (($2,083.24 Parts Cost Wholesale) * (12 Months / 1 Month)) / $5,181.09 Inventory Value = 4.83 (Rounded to two decimal positions) Based on five-day reporting period (based on Detail Report image): Avg Inventory Turns = (($1,067.90 Parts Cost Wholesale) * (12 Months / (5 Days in Reporting Period/30.3333 Days))) / $5,181.09 Inventory Value = 15.01 (Rounded to two decimal positions) |
|
|
The total cost of the parts the selected technician used to complete calls in the reporting period for which the technician was the primary technician. Note: The system uses the cost of the part based on the warehouse (e.g., Tech A's Warehouse) from which the part is taken to complete the call. To view the cost of materials used to complete a service call, access the Service Invoice window, click the Materials tab, and double-click on an item in the Materials display to open the View Report Material window. This window lists the cost of the part.
Note: If the technician assisted with a call, any parts the technician used are listed as part of the parts cost for the primary technician associated with the call.
Calculation: Parts Cost - Wholesale = Sum of Parts Cost for Calls the Selected Technician Worked as the Primary Technician
Example (based on Main Report image and Call Types sub reports image): Parts Cost - Wholesale = $110.00 for SC1106 + $100.00 for SC1107 + $0.00 for SC1108 + $90.00 for SC1109 + $34.95 for SC1110 + $0.00 for SC1111 + $0.00 for SC1114 + $100.00 for SC1115 + $110.00 for SC1113 + $34.95 for SC1116 + $110.00 for SC1117 + $100.00 for SC1118 + $89.00 for SC1119 + $0.00 for SC1120 + $0.00 for SC1121 + $100.00 for SC1122 + $0.00 for SC1125 + $89.00 for SC1126 + $0.00 for SC1127 = $1,067.90 Note: Parts were used on SC1121, but Tech A assisted with that call so the system listed $0.00 for Tech A for that call and listed all parts cost for the call with the primary technician associated with the call (not shown in the report image).
|
|
|
The average cost of the parts the selected technician used per call worked in the reporting period.
Calculation: Avg Parts Cost per Call = Parts Cost Wholesale / Total Calls in Period
Example (based on Main Report image and Call Types sub reports image): Avg Parts Cost per Call = $1,067.90 Parts Cost Wholesale / 19 Calls in Reporting Period = $56.21 (Rounded to 2 decimal positions) |
|
|
The total time between the Dispatch Date/Time and the Arrival Date/Time for all calls worked by the selected technician in the reporting period.
Calculation: Travel Hours in Period = Sum of Time Difference between Dispatch Date/Time and Arrival Date/Time for All Calls Worked by Selected Technician in Reporting Period
Example (based on Main Report image and Call Types sub reports image): Travel Hours in Period = 0.50 for SC1106 + 0.50 for SC1107 + 0.50 for SC1108 + 0.17 for SC1109 + 1.00 for SC1110 + 0.25 for SC1111 + 0.75 for SC1114 + 0.25 for SC1115 + 0.25 for SC1113 + 0.25 for SC1116 + 0.25 for SC1117 +0.25 for SC1118 + 0.50 for SC1119 + 0.50 for SC1120 + 0.25 for SC1121 + 0.25 for SC1122 + 0.25 for SC1125 + 0.50 for SC1126 + 0.25 for SC1127 = 7.42 |
|
|
The total mileage listed in the selected technician's labor records for all calls worked in the reporting period.
Calculation: Total Miles Driven in Period = Sum of Mileage Entered on Add/Edit Labor Window for Each Call Technician Worked in Reporting Period
Example (based on Main Report image and Call Types sub reports image): Total Miles Driven in Period = 15 for SC1106 + 15 for SC1107 + 15 for SC1108 + 10 for SC1109 + 30 for SC1110 + 10 for SC1111 + 30 for SC1114 + 5 for SC1115 + 5 for SC1113 + 10 for SC1116 + 5 for SC1117 + 5 for SC1118 + 15 for SC1119 + 10 for SC1120 + 5 for SC1121 + 5 for SC1122 + 10 for SC1125 + 15 for SC1126 + 10 for SC1127 = 225 |
|
|
The average amount of travel time per call worked by the selected technician in the reporting period.
Calculation: Avg Travel Time per Service Call = Travel Hours in Period / Total Calls in Period
Example (based on Main Report image and Call Types sub reports image): Avg Travel Time per Service Call = 7.42 Travel Hours in Period / 19 Calls in Period = 0.39 (Rounded to 2 decimal position) |
|
|
The average mileage driven per call worked by the selected technician in the reporting period.
Calculation: Avg Miles Driven per Call = Total Miles Driven in Period / Total Calls in Period
Example (based on Main Report image and Call Types sub reports image): Avg Miles Driven per Call = 225 Miles Driven in Period / 19 Calls in Period = 11.84 (Rounded to 2 decimal positions) |
|
|
The average speed driven by the selected technician during all calls worked in the reporting period.
Calculation: Avg Total Miles per Hour = Total Miles Driven in Period / Travel Hours in Period
Example (based on Main Report image and Call Types sub reports image): Avg Total Miles per Hour = 225 Miles Driven in Period / 7.416667 Travel Hours in Period = 30.34 (Rounded to 2 decimal positions) Note: In this calculation, the system is using the Travel Hours value of 7.416667 (before rounding the Travel Hours value to the 2-decimal position value of 7.42 displayed on the report). As a result, the Avg Total Miles per Hour value rounds to 30.34, not the 30.32 that would result if dividing by 7.42 instead of 7.416667.
|
|
|
The total time between the Dispatch Date/Time and the Arrival Date/Time for all calls worked by the selected technician in the reporting period.
Calculation: Customer Hours in Period = Sum of Time Difference between Dispatch Date/Time and Arrival Date/Time for All Calls Worked by Selected Technician in Reporting Period
Example (based on Main Report image and Call Types sub reports image): Customer Hours in Period = 1.50 for SC1106 + 3.00 for SC1107 + 1.00 for SC1108 + 1.00 for SC1109 + 0.75 for SC1110 + 1.00 for SC1111 + 1.50 for SC1114 + 2.00 for SC1115 + 1.25 for SC1113 + 2.00 for SC1116 + 2.00 for SC1117 + 1.00 for SC1118 + 1.00 for SC1119 + 1.00 for SC1120 + 2.00 for SC1121 + 3.00 for SC1122 + 1.25 for SC1125 + 1.00 for SC1126 + 2.00 for SC1127 = 29.25 |
|
| The sum of the customer and travel hours for the selected technician for calls worked in the reporting period.
Calculation: Total Customer & Travel Hours = Customer Hours in Period + Travel Hours in Period
Example (based on Detail Report image): Total Customer & Travel Hours = 29.25 Customer Hours in Period + 7.42 Travel Hours in Period = 36.67 |
|
|
The cost of the labor (customer and travel hours) for the calls the selected technician worked in the reporting period based on the Burden Rate listed on the Positions tab of the technician's Employee record. Calculation: Labor Cost @ Burden Rate = Total Customer & Travel Hours * Technician's Burden Rate
Example (based on Detail Report image): Labor Cost @ Burden Rate = 36.666667 Total Customer & Travel Hours * $65.00 Burden Rate for Tech A = $2,383.34 Note: While the system displays the Total Customer & Travel Hours value rounded to two decimal positions (36.67), the system uses the value rounded to six positions (36.666667) in this calculation.
|
|
|
The average labor cost per call worked by the selected technician in the reporting period.
Calculation: Avg Labor Cost per Call = Total Labor Cost @ Burden Rate / Total Calls in Period
Example (based on Detail Report image): Avg Labor Cost per Call = $2,383.34 Total Labor Cost @ Burden Rate / 19 Total Calls in Period = $125.44 (Rounded to 2 decimal positions) |
|
|
The sum of the part and labor costs.
Calculation: Parts & Labor Total = Total Parts Cost Wholesale + Total Labor Cost @ Burden Rate
Example (based on Detail Report image): Parts & Labor Total = $1,067.90 Parts Cost Wholesale + $2,383.34 Labor Cost @ Burden Rate = $3,451.24 |
The following table provides additional information on the Billable Hours and Overtime columns, for which the detail report lists totals.
|
Report Label |
Calculations |
|
The billable number of hours worked on a service call during normal business hours.
Calculation: Billable Hours per Call = Max (((DateDiff(ArrivalDateTime, DepartureDateTime)) - (Overtime included in DateDiff(ArrivalDateTime, DepartureDateTime)) - (Interrupt Hours)),(1 - Overtime)) Note: If a user overrides the system-calculated value displayed in the Labor hours field of the Add/Edit Labor window, Billable Hours per Call = Labor hours field override value
Examples of Billable Hours per Call (based on Detail Report image with no override values in the Labor hours field): SC1106 (Time Worked > 1 Hour; No Overtime; No Interrupt Time): Billable Hours = Max (((DateDiff(11/28/16 9:00 AM, 11/28/16 10:30 AM)) - (0 Overtime Hours) - (0 Interrupt Hours)),1) = 1.50 SC1107 (Time Worked > 1 Hour; No Overtime; Interrupt Time): Billable Hours = Max (((DateDiff(11/28/16 11:00 AM, 11/28/16 2:00 PM)) - (0 Overtime Hours) - (1 Interrupt Hour)),1) = 2.00 SC1110 (Time Worked < 1 Hour; No Overtime; No Interrupt Time): Billable Hours = Max (((DateDiff(11/29/16 9:15 AM, 11/29/16 10:00 AM)) - (0 Overtime Hours) - (0 Interrupt Hours)),1) = 1.00 SC1114 (Time Worked < 1 Hour; No Overtime; Interrupt Time): Billable Hours = Max (((DateDiff(11/29/16 12:00 PM, 11/29/16 1:30 PM)) - (0 Overtime Hours) - (1 Interrupt Hour)),1) = 1.00 SC1120 (Time Worked = 1 Hour; Overtime; No Interrupt Time): Billable Hours = Max (((DateDiff(11/30/16 4:15 PM, 11/30/16 5:15 PM)) - (0.25 Overtime included in DateDiff(11/30/16 4:15 PM, 11/30/16 5:15 PM)) - (0 Interrupt Hours)),(1 - .25)) = 0.75
Additional Examples of Billable Hours per Call (Not based on Detail Report image): SCXX01 (Time Worked > 1 Hour; Overtime; Interrupt Time): Billable Hours = Max (((DateDiff(12/01/16 4:00 PM, 12/01/16 6:00 PM)) - (1.00 Overtime included in DateDiff(11/30/16 4:00 PM, 11/30/16 6:00 PM)) - (1 Interrupt Hours)),1) = 1.00
Billable Hours in Period = 1.50 for SC1106 + 2.00 for SC1107 + 1.00 for SC1108 + 1.00 for SC1109 + 1.00 for SC1110 + 1.00 for SC1111 + 1.00 for SC1114 + 2.00 for SC1115 + 1.25 for SC1113 + 2.00 for SC1116 + 2.00 for SC1117 + 1.00 for SC1118 + 1.00 for SC1119 + 0.75 for SC1120 + 2.00 for SC1121 + 2.00 for SC1122 + 1.25 for SC1125 + 1.00 for SC1126 + 2.00 for SC1127 = 26.75 |
|
|
The billable number of hours worked on a service call outside of normal business hours.
Calculation: Overtime Hours per Call = Max (((Overtime included in DateDiff(ArrivalDateTime, DepartureDateTime)) - (Interrupt Hours)),(1 - Billable Hours)) Note: If a user overrides the system-calculated value displayed in the Overtime hours field of the Add/Edit Labor window, Overtime Hours per Call = Overtime hours field override value
Example of Overtime Hours per Call (based on Detail Report image with no override values in the Overtime hours field): SC1120 (Time Worked = 1 Hour; Business Hours; No Interrupt Time): Overtime Hours = Max (((Overtime included in DateDiff(11/30/16 4:15 PM, 11/30/16 5:15 PM)) - (0 Interrupt Hours)),(1 - 0.75 Billable Hours)) = 0.25
Additional Examples of Overtime Hours per Call (Not based on Detail Report image): SCXX01 (Time Worked > 1 Hour; Business Hours; Interrupt Time): Overtime Hours = Max (((Overtime included in DateDiff(12/02/16 4:00 PM, 12/02/16 6:00 PM)) - (1 Interrupt Hour)),(1 - 1 Business Hour)) = 0.00 Note: If the amount of Interrupt Time equals or exceeds the amount of Overtime, then remaining time is listed as Business Hours with no Overtime.
SCXX02 (Time Worked > 1 Hour; No Business Hours; No Interrupt Time): Overtime Hours = Max (((Overtime included in DateDiff(12/02/16 5:00 PM, 12/02/16 6:30 PM)) - (0 Interrupt Hours)),1) = 2.00 SCXX03 (Time Worked > 1 Hour; No Business Hours; Interrupt Time): Overtime Hours = Max (((Overtime included in DateDiff(12/03/16 5:00 PM, 12/03/16 6:30 PM)) - (1 Interrupt Hour)),1) = 1.00
Overtime Hours in Period = 0.00 for SC1106 + 0.00 for SC1107 + 0.00 for SC1108 + 0.00 for SC1109 + 0.00 for SC1110 + 0.00 for SC1111 + 0.00 for SC1114 + 0.00 for SC1115 + 0.00 for SC1113 + 0.00 for SC1116 + 0.00 for SC1117 + 0.00 for SC1118 + 0.00 for SC1119 + 0.25 for SC1120 + 0.00 for SC1121 + 0.00 for SC1122 + 0.00 for SC1125 + 0.00 for SC1126 + 0.00 for SC1127 = 0.25 |
Non-supported ReleaseNon-supported Release
©2024 ECI and the ECI logo are registered trademarks of ECI Software Solutions, Inc. All rights reserved.