Service Activity Report by Technician
You can process a Service Activity Report by Technician to analyze service activity by technician.
You can run the report for all dates, a preset date range (e.g., Last Fiscal Quarter), or a custom date range. You can also filter the report by repair code, call type, technician, model, territory, and/or customer ranges. You can choose to show/hide call type details, problem code details, repair code details, and/or category summaries. You can have the report list the number of calls per category summary and/or per call type per technician for which the response time exceeded the number of hours you specify. You can limit the report size by specifying the number of results you want to see. Additionally, you can specify a sort-by column and sort-by order (ascending or descending).
When displaying all data, the main report includes the following information:
Technician Summary Info: Technician, Total Copies Serviced, Average Copies Between Calls, Average Response Time, Average Repair Hours, Average Travel Time, Equipment Count, Average Calls per Equipment, Recall Count, Recall Percentage, Incomplete Call Count, Incomplete Call Percentage, PM Performed Count, PM Performed Percentage, Total Calls, and Mileage
Category Summary Info per Technician: Category Code (e.g., CM, PM), Call Count, Average Response Time, Average Repair Hours, >[Number of Hours] Response Time (Number of calls for which the response time exceeded the response time flag you set for processing the report), Recall Count, Recall Percentage, Incomplete Call Count, Incomplete Call Percentage, PM Performed Count, PM Performed Percentage, Parts Cost, and Supply Costs
Call Type Detail per Technician: Call Type Code, Call Type Code Description, Category Code (i.e., CC for "Courtesy Call", CM for "Corrective Maintenance", IR for "Install/Pickup", O for "Other", PF for "Phone Fix", PM for "Preventive Maintenance", and SH for "Shop Call"), Call Count, Average Response Time, Average Repair Hours, >[Number of Hours] Response Time (Number of calls for which the response time exceeded the response time flag you set for processing the report), Recall Count, Recall Percentage, Incomplete Call Count, Incomplete Call Percentage, PM Performed Count, PM Performed Percentage, Parts Cost, and Supply Costs
Problem Code Detail per Technician: Problem Code, Problem Code Description, Call Count, and Problem Code Percentage
Repair Code Detail per Technician: Repair Code, Repair Code Description, Call Count, and Repair Code Percentage
All Technicians Summary Info: This section lists summary totals for all technicians included in the report.
This report offers drill-down capabilities. By clicking on blue text, you can view call detail sub reports for a selected Call Type, Problem Code, or Repair Code. Each sub report opens an additional window to show more details on which the summary information displayed in the main report is based.
Getting to the ReportGetting to the Report
Log in to e-automate with appropriate permissions.
Click [Reports] to open the Report Console window.
In the left pane, click Service.
In the right pane, double-click Service Activity Report by Technician to open the Service Activity Report by Technician window.
Setting Report ParametersSetting Report Parameters
When setting report parameters, each parameter you have selected displays in the upper portion of the right pane. The parameters do not reset. The report displays with the parameters that were set the last time you ran the report. You can use the following parameters:
DateDate
To filter by date, do the following:
In the left pane of the Service Activity Report by Technician window, select Date to display the Date region in the right pane.
To set a date range, do ONE of the following:
To select a pre-defined date range, use the drop-down menu to select a pre-configured date option (e.g., Last Fiscal Quarter).
To specify a custom date range, do the following:
In the Date region, use the drop-down menu to select <Custom>.
In the From field, enter the beginning date or use the drop-down calendar to select a date.
In the To field, enter the ending date or use the drop-down calendar to select a date.
Repair CodesRepair Codes
To filter by repair code, do the following:
In the left pane of the Service Activity Report by Technician window, select Repair Codes to display the Repair Codes region in the right pane.
Do ONE of the following:
If you want to include all repair codes, in the Repair Codes region, check the Include all Repair Codes checkbox.
If you want to select a range of repair codes, do the following:
Uncheck the Include all Repair Codes checkbox.
In the From field, enter the beginning repair code or use the lookup icon to select a repair code.
In the To field, enter the ending repair code or use the lookup to select a repair code.
Call TypesCall Types
To filter by call type, do the following:
In the left pane of the Service Activity Report by Technician window, select Call Types to display the Call Types region in the right pane.
Do ONE of the following:
If you want to include all call types, in the Call Types region, check the Include all Call Types checkbox.
If you want to select a range of call types, do the following:
Uncheck the Include all Call Types checkbox.
In the From field, enter the beginning call type or use the lookup icon to select a call type.
In the To field, enter the ending call type or use the lookup to select a call type.
If you want to select call types using the advanced filter, do the following:
Uncheck the Include all Call Types checkbox.
Check the Use advanced filter box.
Click the [Advanced filter] button to open the Call Types window.
Use the QuickSearch functionality to filter for thecall type(s) you want to include in the report. For information on using QuickSearch functionality, see the Using the QuickSearch topic.
When the Call Types window displays the call type(s) you want to include in the report, click [OK] to return to the Service Activity Report by Technician window.
TechniciansTechnicians
To filter by technician, do the following:
In the left pane of the Service Activity Report by Technician window, select Technicians to display the Technicians region in the right pane.
Do ONE of the following:
If you want to include all technicians, in the Technicians region, check the Include all Technicians checkbox.
If you want to select a range of technicians, do the following:
Uncheck the Include all Technicians checkbox.
In the From field, enter the beginning technician or use the lookup icon to select a technician.
In the To field, enter the ending technician or use the lookup to select a technician.
If you want to select technicians using the advanced filter, do the following:
Uncheck the Include all Technicians checkbox.
Check the Use advanced filter box.
Click the [Advanced filter] button to open the Technician window.
Use the QuickSearch functionality to filter for the technician(s) you want to include in the report. For information on using QuickSearch functionality, see the Using the QuickSearch topic.
When the Technician window displays the technician(s) you want to include in the report, click [OK] to return to the Service Activity Report by Technician window.
ModelsModels
To filter by model, do the following:
In the left pane of the Service Activity Report by Technician window, select Models to display the Models region in the right pane.
Do ONE of the following:
To include all models, in the Models region, check the Include all Models checkbox.
To specify a range of models to include, do the following:
Uncheck the Include all Models checkbox.
In the From field, enter the beginning model number or use the lookup icon to select a model.
In the To field, enter the ending model number or use the lookup icon to select a model.
TerritoriesTerritories
To filter by territory, do the following:
In the left pane of the Service Activity Report by Technician window, select Territories to display the Territories region in the right pane.
Do ONE of the following:
If you want to include all territories, in the Territories region, check the Include all Territories checkbox.
If you want to select a range of repair codes, do the following:
Uncheck the Include all Territories checkbox.
In the From field, enter the beginning territory or use the lookup icon to select a territory.
In the To field, enter the ending territory or use the lookup to select a territory.
CustomersCustomers
To filter by customer, do the following:
In the left pane of the Service Activity Report by Technician window, select Customers to display the Customers region in the right pane.
Do ONE of the following:
If you want to include all customers, in the Customers region, check the Include all Customers checkbox.
If you want to select a range of customers, do the following:
Uncheck the Include all Customers checkbox.
In the From field, enter the beginning customer number or use the lookup icon to select a customer.
In the To field, enter the ending customer number or use the lookup icon to select a customer.
If you want to select customers using the advanced filter, do the following:
Uncheck the Include all Customers checkbox.
Check the Use advanced filter box.
Click the [Advanced filter] button to open the Customer window.
Use the QuickSearch functionality to filter for the customer(s) you want to include in the report. For information on using QuickSearch functionality, see the Using the QuickSearch topic.
When the Customer window displays the customer(s) you want to include in the report, click [OK] to return to the Service Activity Report by Technician window.
Misc.Misc.
To set miscellaneous options, do the following:
In the left pane of the Service Activity Report by Technician window, select Misc to display the Misc region in the right pane.
In the Misc region, check or uncheck the following boxes as appropriate:
Hide Call Type Details: When checked, the system does not include this detail for each call type per Technician or this summary info per call type for all models: Call Type Code, Call Type Code Description, Category Code (e.g., CM, PM), Call Count, Average Response Time, Average Repair Hours, >[Number of Hours] Response Time (Number of calls for which the response time exceeded the response time flag you set for processing the report), Recall Count, Recall Percentage, Incomplete Call Count, Incomplete Call Percentage, PM Performed Count, PM Performed Percentage, Parts Cost, and Supply Costs.
Hide Problem Code Details: When checked, the system does not include this detail for each problem code per Technician or this summary info per problem code for all models: Problem Code, Problem Code Description, Call Count, and Problem Code Percentage.
Hide Repair Code Details: When checked, the system does not include this detail for each repair code per Technician or this summary info per repair code for all models: Repair Code, Repair Code Description, Call Count, and Repair Code Percentage.
Hide Category Summary: When checked, the system does not include this category summary information per Technician or this summary info per category for all models: Category Code (i.e., CC for "Courtesy Call", CM for "Corrective Maintenance", IR for "Install/Pickup", O for "Other", PF for "Phone Fix", PM for "Preventive Maintenance", and SH for "Shop Call"), Call Count, Average Response Time, Average Repair Hours, >[Number of Hours] Response Time (Number of calls for which the response time exceeded the response time flag you set for processing the report), Recall Count, Recall Percentage, Incomplete Call Count, Incomplete Call Percentage, PM Performed Count, PM Performed Percentage, Parts Cost, and Supply Costs
Note: If you uncheck all four boxes, the system will include only the following summary detail for each make and model: Make, Model, Total Copies Serviced, Average Copies Between Calls, Average Response Time, Average Repair Hours, Average Travel Time, Equipment Count, Average Calls per Equipment, Recall Count, Recall Percentage, Incomplete Call Count, Incomplete Call Percentage, PM Performed Count, PM Performed Percentage, Total Calls, and Mileage
Response Time FlagResponse Time Flag
The number of response time hours, greater than which, you want the report to count a call in the >[Response Time]HrR/T column (where [Response Time] is the value in hours you specify here in the Response Time Flag field).
Note: The >[Response Time]HrR/T column is only displayed when you process the report with the Hide Call Type Details box unchecked and/or with the Hide Category Summary box unchecked, indicating the report should list this information as part of the call type detail and/or category summary, respectively.
Note: This field allows two decimal positions. If you want to count calls where the response time exceeded 3 hours and 45 minutes, enter 3.75 in the Response Time Flag field. The report will list the counts in the >3.75HrR/T column.
Number of ResultsNumber of Results
To specify the number of results to include, do the following:
In the left pane of the Service Activity Report by Technician window, select Number of Results to display the Number of Results region in the right pane.
Do ONE of the following:
To include all results, check the Return all results box.
To specify the number of results to include, do the following:
Uncheck the Return all results box.
In the entry field, specify the number of results to return.
Sort ColumnSort Column
To select a column by which to sort the data listed for each contract, do the following:
In the left pane of the Service Activity Report by Technician window, select Sort Column to display the Sort Column region in the right pane.
In the Sort Column region, set Sort Column to the column by which you want the report data sorted.
Sort OrderSort Order
To specify a sort order for the column by which to sort the service activity listed for each make and model, do the following:
In the left pane of the Service Activity Report by Technician, select Sort Order to display the Sort Order region in the right pane.
In the Sort Order region, select Ascending or Descending.
Processing the ReportProcessing the Report
On the Service Activity Report by Technician window, click [OK] to process the report.
Viewing Sub ReportsViewing Sub Reports
Using the main report's drill-down capabilities, you can view Call Type, Problem Code, and Repair Code sub reports.
To view the Call Type sub report, you must process the main report with the Hide Call Type Details box unchecked.
To view the Problem Code sub report, you must process the main report with the Hide Problem Code Details box unchecked.
To view the Repair Code sub report, you must process the main report with the Hide Repair Code Details box unchecked.
Call TypeCall Type
The Call Type sub report includes the following information:
Call Detail: Call Number, Date, Technician, Response Time, Equipment Number, Serial Number, Equipment Description, Call Type, Recall (Yes/No), RS (Yes/No)
Number of Calls
To view the Call Type sub report, do the following:
Verify the main report has been run with the Hide Call Type Details box unchecked.
Locate the technician for whom you want to view the Call Type sub report.
Click the Call Type link (displayed in blue font) to have the system display the sub report in a separate window.
Problem CodeProblem Code
The Problem Code sub report includes the following information:
Call Detail: Call Number, Date, Technician, Call Type, Equipment Number, Serial Number, Equipment Description, Material Cost, Recall (Yes/No), RS (Yes/No)
Problem Code Detail: Problem Code, Problem Code Description
Number of Calls
To view the Problem Code sub report, do the following:
Verify the main report has been run with the Hide Problem Code Details box unchecked.
Locate the technician for whom you want to view the Problem Code sub report.
Click the Problem Code link (displayed in blue font) to have the system display the sub report in a separate window.
Repair CodeRepair Code
The Repair Code sub report includes the following information:
Call Detail: Call Number, Date, Technician, Call Type, Equipment Number, Serial Number, Equipment Description, Material Cost, Recall (Yes/No), RS (Yes/No)
Repair Code Detail: Repair Code, Repair Code Description
Number of Calls
To view the Repair Code sub report, do the following:
Verify the main report has been run with the Hide Repair Code Details box unchecked.
Locate the technician for whom you want to view the Repair Code sub report.
Click the Repair Code link (displayed in blue font) to have the system display the sub report in a separate window.
Understanding Report CalculationsUnderstanding Report Calculations
Main ReportMain Report
Following is an excerpt of the main Service Activity Report by Technician. The table below this image identifies the source of each of these numbers and/or the calculations for arriving at these numbers. The additional sections of this topic provide similar information for each of the sub reports on which these numbers are based.
Note: To jump to a specific calculation, click a number in the sample report image. To view a Call Type, Problem Code, or Repair Code sub report associated with this image, click the blue CQ, EP, E, or C text in the image below. For the links within this topic to work, you must click the online help's [Expand All] button; the browser will not display a link in content that is hidden.
Note: This sample report and the related sub reports are designed for the sole purpose of illustrating multiple calculation scenarios; they are not intended to represent a realistic or best practices portrayal of model profitability activity.
Main Report Image
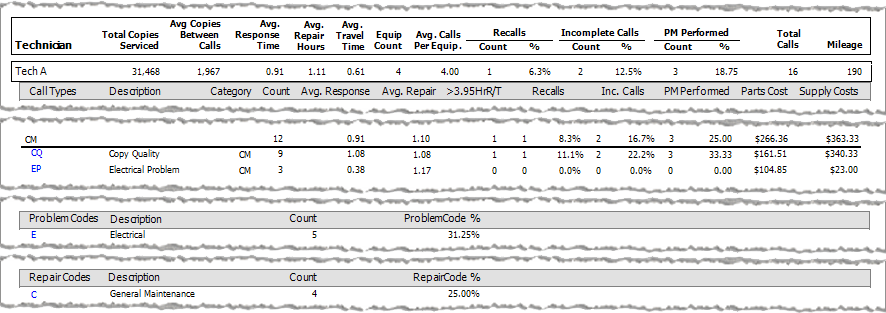
The following table identifies the source of each of the numbers and/or the calculations for arriving at the numbers in the main Service Activity Report by Technician.
Note: All times are displayed in hours with two decimal positions (e.g., 0.75 hours = 45 minutes).
|
Report Label |
Calculations |
|
Technician Info |
|
|
The sum of the copies recorded on the Invoice Call window's Meters tab between the lowest meter reading for a service call invoiced within the reporting period and the highest reading for a service call invoiced within the reporting period or—if available—the next highest reading outside the reporting period for the default meter on each of the machines included in the reporting period for a specific make/model.
Calculation: Total Copies per Default Meter per Machine per Technician = Last Meter Reading for Default Meter per Machine Included in Reporting Period (or Next Meter Reading for Default Meter per Machine after Reporting Period) - First Meter Reading for Default Meter per Machine Included in Reporting Period
Example (based on Main Report image): The Equipment Count for Tech A indicates 4 machines were included in this report. The Call Details, Problem Codes, and Repair Codes sub reports list the Equipment numbers. For this sample, the equipment numbers are EQ10115, EQ10116, EQ10117, and EQ10118. The report was processed for date range 1/1/16 to 12/31/16. Viewing the meter history for these machines within the report date range and using only calls with a Meter source of Service Call for the default (B\W) meter only, these machines have the following start and end values for calls listed within the report date range: EQ10116: 3,518 B\W recorded for service call on 3/7/16 - 0 B\W recorded for service call on 1/6/16 = 3,518 EQ10117: 8,371 B\W recorded for service call on 8/10/16 - 0 B\W recorded for service call on 1/7/16 = 8,371 EQ10118: 9,255 B\W recorded for service call on 9/30/16 - 0 B\W recorded for service call on 1/8/16 = 9,255
Total Count for Default (B\W) Meter for Tech CM = 10,324 for EQ10115 B\W Meter + 3,518 for EQ10116 B\W Meter + 8,371 for EQ10117 B\W Meter + 9,255 for EQ10118 B\W Meter = 31,468
If a service call had been invoiced for EQ10116 with a B\W reading of 12,117 recorded on 1/23/2017, the system would have calculated the total copies serviced as follows: EQ10116: 12,117 B\W recorded for service call on 1/23/17 - 0 B\W recorded for service call on 1/6/16 = 3,518 EQ10117: 8,371 B\W recorded for service call on 8/10/16 - 0 B\W recorded for service call on 1/7/16 = 8,371 EQ10118: 9,255 B\W recorded for service call on 9/30/16 - 0 B\W recorded for service call on 1/8/16 = 9,255
Total Count for Default (B\W) Meter for Tech CM = 10,324 for EQ10115 B\W Meter + 12,117 for EQ10116 B\W Meter + 8,371 for EQ10117 B\W Meter + 9,255 for EQ10118 B\W Meter = 40,067 |
|
|
The average number of copies per call within the reporting period for a specific technician. The number of copies is based on the default meter only. Copies accrues from the service meter reading recorded at the time the service call was invoiced within the reporting period until either the last available service meter reading recorded for the equipment within the reporting period or—if available—until the next available service meter reading recorded for the equipment after the ending date of the reporting period.
Calculation: Average Copies Between Calls per Technician = (Total Copies per Default Meter per Machine per Technician)/(Total Calls per Technician)
Example (based on Main Report image): Average Copies Between Calls for Tech A = (31,468 Total Copies per Default Meter per Machine for Tech CM) / (16 Total Calls for Tech A) = 1,967 (rounded) |
|
|
The average amount of time that elapsed per call for a specific technician during normal business hours between the time the call was received and the time the technician arrived at the call, provided the call had a Call Type Category of CM and the call was not an incomplete call.
Calculation: Avg. Response = Total Response Time for All Calls for Call Type Category CM excluding Response Time for Incomplete Calls / Total Calls for Call Type Category CM
Example (based on Main Report image and Call Type sub report images): Average Response Time per Call for Tech A = (9.75 Hours for Call Type CQ + 1.13 Hours for Call Type EP)/(9 Calls for Call Type CQ + 3 Calls for Call Type EP) = 0.91 Hours (rounded to 2 decimal positions) |
|
|
The average amount of time it took to complete a call for a specific technician that met the report parameters.
Calculation: Average Repair Time per Call per Technician = (Total Repair Time for All Calls for Technician) / (Total Calls for Technician)
Example (based on Main Report image and Call Type sub report images): Average Repair Time per Call for Tech A = (13.25 Hours for Call Type Category CM + 4.50 Hours for Call Type Category IR [not shown])/(16 Calls for Tech A) = 1.11 Hours (rounded to 2 decimal positions) |
|
| The average amount of time per call that elapsed between the time the call was dispatched and the time a technician arrived at the call for each call for a specific technician that met the report parameters.
Calculation: Travel Time per Call per Technician = Time Difference between Dispatched Date/Time and Arrival Date/Time Avg. Travel Time per Technician = (Total Travel Time per Make/Model) / (Total Calls per Make/Model)
Example (based on Main Report image and Call Type sub report images): Travel Time per SC1133 (Not shown in sample images) = Time Difference between 1/5/2016 10:24 AM Dispatched Date/Time and 1/5/2016 10:54 AM Arrival Date/Time = 0.5 Hours |
|
| The number of different equipment items a specific technician serviced that met the report parameters. In this example, 4 different machines (EQ10115, EQ10116, EQ10117, and EQ10118) met the report parameters for Tech A. The Problem Code and Repair Code sub reports reference these machines. | |
|
The average number of calls per equipment for a specific technician that met the report parameters. Calculation: Average Calls per Equipment per Technician = (Total Calls per Technician)/(Equipment Count per Technician)
Example (based on Main Report image): Average Calls per Equipment for Tech A = (16 Total Calls for Tech A)/(4 Equipment Count for Tech A) = 4.00 |
|
|
The number of calls per technician for which the call met your system's call back parameters and for which the Override call back box was not checked for the call on the New/Edit Service Work Order window.
Calculation: Recalls Count per Technician = Sum (Recalls per Call Type Category per Technician)
Example (based on Main Report image): Recalls Count for Tech A = 1 Recall for Call Type Category CM + 0 Recalls for Call Type Category IR (not shown) = 1 Recall |
|
|
The average number of calls in the reporting period per technician for which the call met your system's call back parameters and for which the Override call back box was not checked for the call on the New/Edit Service Work Order window.
Recalls Percentage per Technician = (Number of Recalls per Technician)/(Total Calls per Technician)
Example (based on Main Report image): Recalls Percentage for Tech A = (1 Recall for Tech A)/(16 Calls for Tech A) = 6.3% (rounded to one decimal position) |
|
|
The number of Incomplete Calls per technician that met the report parameters.
Calculation: Incomplete Calls Count per Technician = Sum (Incomplete Calls per Call Type Category per Technician)
Example (based on Main Report image): Incomplete Calls Count for Tech A = 2 Incomplete Calls for Call Type Category CM + 0 Incomplete Calls for Call Type Category IR (not shown) = 2 Incomplete Calls |
|
|
The average number of Incomplete Calls in the reporting period per Call Type Category that met the report parameters.
Calculation: Incomplete Calls Percentage per Technician = (Number of Incomplete Calls per Technician)/(Total Calls per Technician)
Example (based on Main Report image): Incomplete Calls Percentage for Tech A = (2 Incomplete Calls for Tech A)/(16 Calls for Tech A) = 12.5% (rounded to one decimal position) |
|
|
The number of calls per technician where preventive maintenance was performed.
Calculation: PM Performed Calls Count per Technician = Sum (Calls with Preventive maintenance box checked per Call Type Category per Technician)
Example (based on Main Report image): PM Performed Calls Count for Tech A = 3 PM Performed Call for Call Type Category CM + 0 PM Performed Calls for Call Type Category IR (not shown) = 3 PM Performed Calls |
|
|
The average number of Preventive Maintenance (PM) Calls per Call Type Category that met the report parameters.
Calculation: PM Performed Calls Percentage per Technician = (Number of PM Performed Calls per Call Type Category)/(Total Calls per Call Type Category)
Example (based on Main Report image): PM Performed Calls Percentage for Tech A = (3 PM Performed Calls for Tech A)/(16 Calls for Tech A) = 18.75% (rounded to two decimal positions) |
|
|
The number of calls per technician that met the report parameters.
Calculation: Total Calls per Technician = Sum(Call Count for Each Call Type Category per Technician)
Example (based on Main Report image and Call Type sub report images): Total Calls for Tech A = 12 Calls for Call Type Category CM + 4 Calls for Call Type Category IR (not shown) = 16 Calls |
|
| The number of miles recorded in the Mileage field on the Add/Edit Labor window for all calls for a specific technician that met the report parameters.
Calculation: Total Mileage per Technician = Sum(Travel Time per Call per Make/Model)
Example (based on Main Report image): Total Travel Time for Tech A (Not shown in sample images) = 10 or SC1033 + 15 for SC1034 + 15 for SC1035 + 15 for SC1036 + 10 for SC1037 + 15 for SC1038 + 10 for SC1039 + 10 for SC1040 + 10 for SC1041 + 10 for SC1042 + 15 for SC1043 + 10 for SC1044 + 10 for SC1045 + 10 for SC1046 + 15 for SC1047 + 10 for SC1048 = 190 Miles |
|
|
Call Type Category Summary Info per Technician |
|
|
The number of calls for the selected Call Type Category per technician that met the report parameters.
Calculation: Count for Call Type Category = Sum(Counts for Each Call Type in Category)
Example (based on Main Report image and Call Type sub report images): Count for Call Type Category CM = 9 Calls for Call Type CQ + 3 Calls for Call Type EP = 12 |
|
|
Calculation: Avg. Response per Call per Call Type Category = Total Response Time for All Calls for Call Type Category CM excluding Response Time for Incomplete Calls / Total Calls for Call Type Category CM
Example (based on Main Report image and Call Type sub report images): Average Response Time for Call Type Category CM = (9.75 Hours for Call Type CQ + 1.13 Hours for Call Type EP)/(9 Calls for Call Type CQ + 3 Calls for Call Type EP) = 0.91 Hours (rounded to 2 decimal positions) |
|
|
Calculation: Avg. Repair Time per Call per Call Type Category = Total Repair Time for All Calls for Call Type Category / Total Calls for Call Type Category
Example (based on Main Report image and Call Type sub report images): Average Repair Time for Call Type Category CM = (9.75 Hours for Call Type CQ + 3.50 Hours for Call Type EP)/(9 Calls for Call Type CQ + 3 Calls for Call Type EP) = 1.10 Hours (rounded to 2 decimal positions) |
|
|
The number of calls per Call Type Category where the call's Response Time exceeded [Number]rR/T (where Number is the number of hours you specified in the Response Time Flag field at the time of processing this report).
Calculation: >[Number]rR/T per Call Type Category = Sum (>[Number]rR/T Calls per Call Type in Call Type Category)
Example (based on Main Report image): >[3.95]rR/T per Call Type Category CM = 1 Call for Call Type CQ + 0 Calls for Call Type EP = 1 Call Note: The sample report was processed with a Response Time Flag value of 3.95 hours, so the report shows a >3.95HrR/T column. |
|
|
The number of calls per Call Type Category for which the call met your system's call back parameters and for which the Override call back box was not checked for the call on the New/Edit Service Work Order window.
Calculation: Recalls Count per Call Type Category = Sum (Recalls per Call Type in Call Type Category)
Example (based on Main Report image): Recalls Count for Call Type Category CM = 1 Recall for Call Type CQ + 0 Recalls for Call Type EP = 1 Recall |
|
|
The average number of calls in the reporting period per Call Type Category for which the call met your system's call back parameters and for which the Override call back box was not checked for the call on the New/Edit Service Work Order window.
Calculation: Recalls Percentage per Call Type Category = Number of Recalls per Call Category / Total Calls per Call Type Category
Example (based on Main Report image): Recalls Percentage for Call Type Category CM = 1 Recall for Call Type Category CM / 12 Calls for Call Type Category CM = 8.3% (rounded to one decimal position) |
|
|
The number of Incomplete Calls per Call Type Category that met the report parameters.
Calculation: Incomplete Calls Count per Call Type Category = Sum (Incomplete Calls per Call Type in Call Type Category)
Example (based on Main Report image): Incomplete Calls Count for Call Type Category CM = 2 Incomplete Calls for Call Type CQ + 0 Incomplete Calls for Call Type EP = 2 Incomplete Calls |
|
|
The average number of Incomplete Calls in the reporting period per Call Type Category that met the report parameters.
Calculation: Incomplete Calls Percentage per Call Type Category = Number of Incomplete Calls per Call Type Category / Total Calls per Call Type Category
Example (based on Main Report image): Incomplete Calls Percentage for Call Type Category CM = 2 Incomplete Calls for Call Type Category CM / 12 Calls for Call Type Category CM = 16.7% (rounded to one decimal position) |
|
|
The number of calls per Call Type Category where preventive maintenance was performed.
Calculation: PM Performed Calls Count per Call Type Category = Sum (Calls with Preventive maintenance box checked per Call Type in Call Type Category)
Example (based on Main Report image): PM Performed Calls Count for Call Type Category CM = 3 PM Performed Calls for Call Type CQ + 0 PM Performed Calls for Call Type EP = 3 PM Performed Calls |
|
|
% |
The average number of Preventive Maintenance (PM) Calls per Call Type Category that met the report parameters.
Calculation: PM Performed Calls Percentage per Call Type Category = Number of PM Performed Calls per Call Type Category / Total Calls per Call Type Category
Example (based on Main Report image): PM Performed Calls Percentage for Call Type Category CM = 3 PM Performed Call for Call Type Category CM / 12 Calls for Call Type Category CM = 25.00% (rounded to two decimal positions) |
| The total cost of items with a service code of P (Parts) that have been added to a service call per Call Type Category that met the report parameters.
Calculation: Parts Cost per Call Type Category = Sum (Parts Cost per Call Type)
Example (based on Main Report image): Parts Cost for Call Type Category CM = $161.51 for Call Type CQ + $104.85 for Call Type EP = $266.36 |
|
| The total cost of items with a service code of S (Supply) that have been added to a service call per Call Type Category that met the report parameters.
Calculation: Supply Cost per Call Type Category = Sum (Parts Cost per Call Type)
Example (based on Main Report image): Parts Cost for Call Type Category CM = $340.33 for Call Type CQ + $23.00 for Call Type EP = $363.33 |
|
|
Call Type Summary Info per Call Type Category per Technician |
|
|
The number of calls for the selected Call Type per Call Type Category per Technician that met the report parameters.
Example (based on Main Report image and Call Type sub report images): Count for Call Type CQ = 9 |
|
|
Calculation: Avg. Response per Call per Call Type = Total Response Time for All Calls for Call Type / Total Calls for Call Type
Example (based on Main Report image and Call Type sub report images): Average Response Time for Call Type CQ = (Response Time Hours 1.00 for SC1138 + 0.75 for SC1140 + 0.00 for SC1142 + 0.90 for SC1143 + 5.83 for SC1145 + 0.52 for SC1146 + 0.75 for SC1148 = )/ 9 Calls for Call Type = 1.08 Hours (rounded to 2 decimal positions) |
|
|
Calculation: Average Repair Time per Call per Call Type = Total Repair Time for All Calls for Call Type / Total Calls for Call Type
Example (based on Main Report image and Call Type sub report images): Average Repair Time per Call for Call Type CQ = (Repair Hours 1.00 for SC1038 + 1.00 for SC1039 + 1.00 for SC1040 + 1.00 for SC1042 + 1.50 for SC1043 + 1.00 for SC1045 + 1.00 for SC1046 + 1.25 for SC1047 + 1.00 for SC1048)/9 Calls for Call Type = 1.08 Hours (rounded to 2 decimal positions) |
|
|
Calculation: >[Number]rR/T = Number of Calls for Call Type where the call's Response Time exceeded [Number]rR/T (where Number is the number of hours you specified in the Response Time Flag field at the time of processing this report)
Example (based on Main Report image and Call Types sub report images): The sample report was processed with a Response Time Flag value of 3.95 hours, so the report shows a >3.95HrR/T column. |
|
|
Calculation: Recalls Count per Call Type = Number of Calls for Call Type where the Recall column of the Call Type sub report lists Yes, indicating the call met the parameters defined in your system for identifying the call as a Recall Call.
Example (based on Main Report image and Call Types sub report images): Recalls Count for Call Type CQ = 1; SC1145 met the system's call back parameters, so the Call Type's sub report lists a Yes in the Recalls column and the Recalls Count for CQ lists a count of 1. |
|
|
Calculation: Recalls % per Call Type = Total Recalls for Call Type / Total Calls for Call Type
Example (based on Main Report image and Call Types sub report images): Recalls % for Call Type CQ = 1 Recall / 9 Calls for Call Type = 11.1% |
|
|
Calculation: Inc. Calls Count per Call Type = Number of Calls for Call Type where the Inc. Call column of the Call Type sub report lists Yes, indicating the call was identified as an Incomplete Call.
Example (based on Main Report image and Call Types sub report images): Inc. Calls Count for Call Type CQ = 2; SC1139 and SC1147 were identified as Incomplete Calls, so the Call Type's sub report lists a Yes in the Inc. Call column and the Inc. Calls Count for CQ lists a count of 2. |
|
|
Calculation: Inc. Calls % per Call Type = Total Incomplete Calls for Call Type / Total Calls for Call Type
Example (based on Main Report image and Call Types sub report images): Inc. Calls % for Call Type CQ = 2 Incomplete Calls / 9 Calls for Call Type = 22.2% |
|
|
Calculation: PM Performed Count per Call Type = Number of Calls for Call Type where the Preventive maintenance box was checked on the Service Report tab of the Service Invoice window for the service call.
Example (based on Main Report image): PM Performed Count for Call Type CQ = 3; the Preventive maintenance box was checked on the Service Report tab of the Service Invoice window for calls SC1140, SC1143, and SC1146, so the PM Performed Count for CQ = 3. |
|
|
% |
Calculation: PM Performed % per Call Type = Total PM Performed Calls for Call Type / Total Calls for Call Type
Example (based on Main Report image): PM Performed % for Call Type CQ = 3 PM Calls / 9 Calls for Call Type = 33.3% |
| The total cost of items with a service code of P (Parts) that have been added to a service call with the selected Call Type that met the report parameters.
Calculation: Parts Cost per Call Type = Sum (Parts Cost per Call Type)
Example (based on Main Report image and Call Types sub report images): Parts Cost for Call Type CQ = ($0.00 for SC1038) + ($110 for Board + $12.17 for Wheel for SC1039) + ($0.00 for SC1040) + ($0.00 for SC1042) + ($15 for Clutch for SC1043) + ($12.17 for Wheel for SC1045) + ($12.17 for Wheel for SC1046) + ($0.00 for SC1047) + ($0.00 for SC1048) = $161.51 |
|
| The total cost of items with a service code of S (Supply) that have been added to a service call with the selected Call Type that met the report parameters.
Calculation: Supply Cost per Call Type = Sum (Parts Cost per Call Type)
Example (based on Main Report image and Call Types sub report images): Supply Cost for Call Type CQ = ($100.00 for Developer for SC1038) + ($0.00 for SC1039) + ($0.00 for SC1040) + ($99.00 for Drum for SC1042) + ($0.00 for SC1043) + ($56.00 for Paper for SC1045) + ($0.00 for SC1046) + ($85.33 for Toner for SC1047) + ($0.00 for SC1048) = $340.33 |
|
|
Problem Codes Detail per Technician |
|
|
The number of service calls for a specific technician that were closed with a specific problem code.
Example (based on Main Report image and Problem Code sub report image): Count for Problem Code E = 5 |
|
|
The percentage of calls for a specific technician that were closed with a specific problem code.
Calculation: Problem Code % per Make/Model = Number of Calls with this Problem Code for this Make/Model / Total Calls for this Technician
Example (based on Main Report image and Problem Code sub report image): E - Electrical Problem Code % for Tech A = 5 Calls with this Problem Code / 16 Total Calls for Tech A = 31.25% |
|
|
Repair Codes Detail per Technician |
|
|
The number of service calls for a specific technician that were closed with a specific repair code.
Example (based on Main Report image and Repair Code sub report image): Count for Repair Code C = 4 |
|
|
The percentage of calls for a specific technician that were closed with a specific repair code.
Calculation: Repair Code % per Technician = Number of Calls with this Repair Code per Technician / Total Calls per Technician
Example (based on Main Report image and Repair Code sub report image): C - Clean Repair Code % for Tech A = 4 Calls with this Repair Code for Tech A / 16 Total Calls for Tech A = 25.00%
Note: The percentages listed in the Repair Code % column will only add up to 100% if you have an exact ratio of one repair code to one service call. Because a service call can be closed with no repair codes or with multiple repair codes, the percentages listed in this column are unlikely to add up to 100% percent. If multiple repair codes are listed for most service calls, the percentages may add up to more than 100%. If multiple calls are closed with no repair codes, the percentages may add up to less than 100%. |
|
Call Type Sub ReportCall Type Sub Report
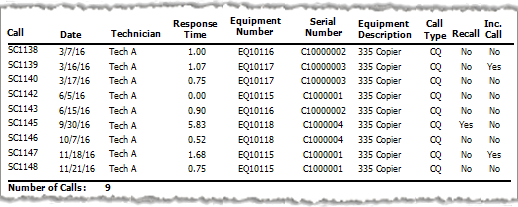
Following are excerpts of the Service Activity Report by Model Call Type sub reports for Call Type Category CM, which the system would display if you clicked the blue CQ and EP text in the Call Types section of the main Service Activity Report by Model.
|
Service Activity Report by Technician Call Type Sub Report Images for Call Type Category CM |
|
|
Call Type: CQ |
 |
|
Call Type: EP |
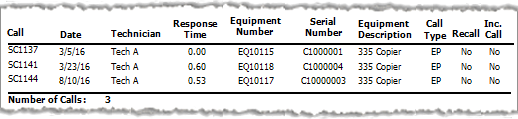 |
The following table explains how the data in the Call Type sub reports is used to calculate values displayed in the main report.
Note: All times are displayed in hours with two decimal positions (e.g., 0.75 hours = 45 minutes).
|
Report Label |
Calculations |
|
The amount of time that elapsed during normal business hours between the time the call was received and the time the tech arrived at the call.
Examples (based on Call Type sub report images above this table): Response Time for SC1137: The call was dispatched on a Saturday, 3/5/16, at 10:44 AM and Tech A arrived at 11:14 AM that same day. Since this time period occurred outside of normal business hours, Response Time for SC1137 = 0.00 Hours. Response Time for SC1138: The call was dispatched on a Saturday, 3/5/16, at 11:30 AM and Tech A arrived at 9:00 AM on the next business day, Monday, 3/7/2016. Date/Time Difference between 11:30 AM Call received at time after normal business hours and 9:00 AM tech Arrival time during normal business hours on the next business day = 45.50 Hours - 44.50 Hours outside of normal business hours = 1.00 Hour (8:00 AM to 9:00 AM on Monday 3/7/2016) |
|
|
A Yes in this column indicates the call met your system's recall parameters and the Override call back box was not checked for the call on the New/Edit Service Work Order window. Examples (based on Problem Code sub report image above this table): On Friday, 9/30, Tech A worked Call SC1145 for Equipment EQ10118. On Friday, 10/7, Tech A worked Call SC1146 for the same customer. The Options window (Tools > Options > Service calls > Dispatch console) has a Call back number of days value of 15. Because SC1146 occurred within the 15 day window for identifying a call as a call back and because the Override call back box was not checked for SC1146, the system listed Yes in the Recall column for SC1145 (the call for which the call back occurred). |
|
|
A Yes in this column indicates the service call was not completed and required scheduling an additional service call to complete the service. Examples (based on Problem Code sub report image above this table): On Wednesday, 3/16, Tech A worked Call SC1139. At the end of the work day, Tech A marked the call incomplete, rescheduled a follow-up call for the next day (SC1140 on Thursday, 3/17), and then completed the rescheduled call. The system listed Yes in the Inc. Call column for SC1139 (the call the technician marked as incomplete). |
|
|
The number of calls for a specific Call Type per technician that met the report parameters. Total Number of Calls per Call Type per Technician = Sum(Calls per Call Type per Make/Model)
The Call Type sub report for Call Type CQ lists the 9 calls with this Call Type for Tech A that met the report parameters. |
Problem Code Sub ReportProblem Code Sub Report
Following is an excerpt of the Service Activity Report by Model's Problem Code sub report, which the system would display if you clicked the blue E in the Problem Codes section of the sample image of the main Service Activity Report by Model:
Service Activity Report by Model's Problem Code Sub Report for Problem Code "E - Electrical"
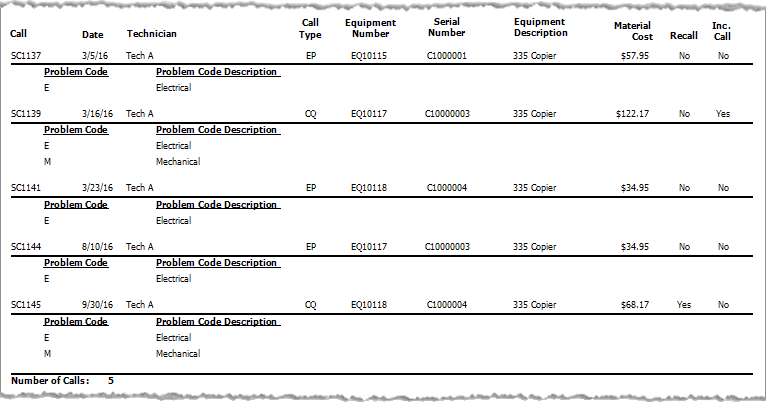
The following table explains how the data in the Problem Code sub report relates to information displayed in the main report.
|
Report Label |
Calculations |
| The total cost of items (Parts and Supplies) that have been added to a service call with the selected Problem Code that met the report parameters.
Calculation: Parts Cost per Call per Problem Code = Sum (Parts Cost per Call per Problem Code)
Examples (based on Problem Code sub report image above this table): Parts Cost for Call SC1137 for Problem Code E = $34.95 for Power Switch + $23.00 for Staples = $58.95 Parts Cost for Call SC1144 for Problem Code E = $34.95 for Power Switch |
|
|
A Yes in this column indicates the call met your system's recall parameters and the Override call back box was not checked for the call on the New/Edit Service Work Order window.
Examples (based on Problem Code sub report image above this table): On Friday, 9/30, Tech A worked Call SC1145 for Equipment EQ10118. On Friday, 10/7, Tech A worked Call SC1146 for the same customer. The Options window (Tools > Options > Service calls > Dispatch console) has a Call back number of days value of 15. Because SC1146 occurred within the 15 day window for identifying a call as a call back and because the Override call back box was not checked for SC1146, the system listed Yes in the Recall column for SC1145 (the call for which the call back occurred). |
|
|
A Yes in this column indicates the service call was not completed and required scheduling an additional service call to complete the service.
Examples (based on Problem Code sub report image above this table): On Wednesday, 3/16, Tech A worked Call SC1139. At the end of the work day, Tech A marked the call incomplete, rescheduled a follow-up call for the next day (SC1140 on Thursday, 3/17), and then completed the rescheduled call. The system listed Yes in the Inc. Call column for SC1139 (the call the technician marked as incomplete). |
|
|
The number of calls for a specific Problem Code per Make/Model that met the report parameters. Total Number of Calls per Problem Code per Make/Model = Sum(Calls per Problem Code per Make/Model)
The Call Type sub report for Problem Code E lists the 5 calls with this Problem Code for this Make/Model that met the report parameters. |
Repair Code Sub ReportRepair Code Sub Report
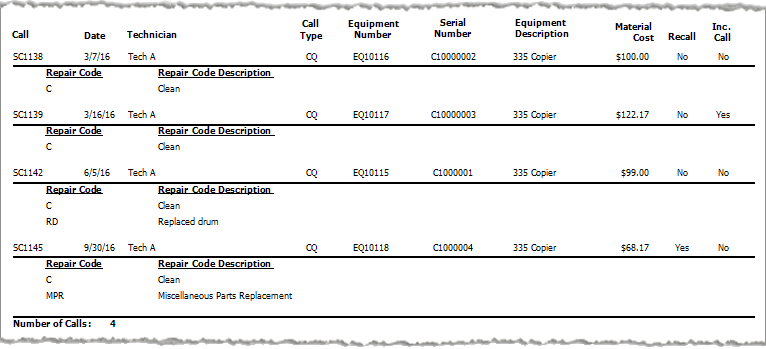
Following is an excerpt of the Service Activity Report by Model's Repair Code sub report, which the system would display if you clicked the blue C in the Repair Codes section of the sample image of the main Service Activity Report by Model:
Service Activity Report by Model's Repair Code Sub Report for Repair Code "C - Clean"
The following table explains how the data in the Repair Code sub report relates to information displayed in the main report.
|
Report Label |
Calculations |
| The total cost of items (Parts and Supplies) that have been added to a service call with the selected Repair Code that met the report parameters.
Calculation: Parts Cost per Call per Repair Code = Sum (Parts Cost per Call per Problem Code)
Examples (based on Repair Code sub report image above this table): Parts Cost for Call SC1138 for Repair Code C = $100.00 for Developer = $100.00 Parts Cost for Call SC1139 for Repair Code C = $110.00 for Board + $12.17 for Wheel = $122.17 Parts Cost for Call SC1145 for Repair Code C = $12.17 for Wheel + $56.00 for Paper = $68.17 |
|
|
A Yes in this column indicates the service call was not completed and required scheduling an additional service call to complete the service. Examples (based on Problem Code sub report image above this table): On Wednesday, 3/16, Tech A worked Call SC1139. At the end of the work day, Tech A marked the call incomplete, rescheduled a follow-up call for the next day (SC1140 on Thursday, 3/17), and then completed the rescheduled call. The system listed Yes in the Inc. Call column for SC1139 (the call the technician marked as incomplete). |
|
|
The number of calls for a specific Problem Code per Make/Model that met the report parameters. Total Number of Calls per Problem Code per Make/Model = Sum(Calls per Problem Code per Make/Model)
The Call Type sub report for Problem Code E lists the 5 calls with this Problem Code for this Make/Model that met the report parameters. |
|
|
The number of calls for a specific Repair Code per Make/Model that met the report parameters. Total Number of Calls per Repair Code per Make/Model = Sum(Calls per Problem Code per Make/Model)
The Call Type sub report for Repair Code C lists the 4 calls with this Repair Code for this Make/Model that met the report parameters. |
Non-supported ReleaseNon-supported Release
©2022 ECI and the ECI logo are registered trademarks of ECI Software Solutions, Inc. All rights reserved.